Introduction:
The markets can either be trending or consolidating/sideways. It is a popular belief that the markets are sideways for 70% of the time and trending for only 30% of the time. In the simplest terms, trend following means capturing the trends and big price moves make profitable trades.
Trend following indicators perform poorly during sideways trend but they are capable of capturing big price moves when a trend develops. Trend following systems are developed keeping in mind that many small losses that are incurred during the sideways markets will be covered by the few large profits made during trending markets and eventually end up being profitable. In this article, we will be discussing the 5 most popular trend-following indicators.
What is a trend ?
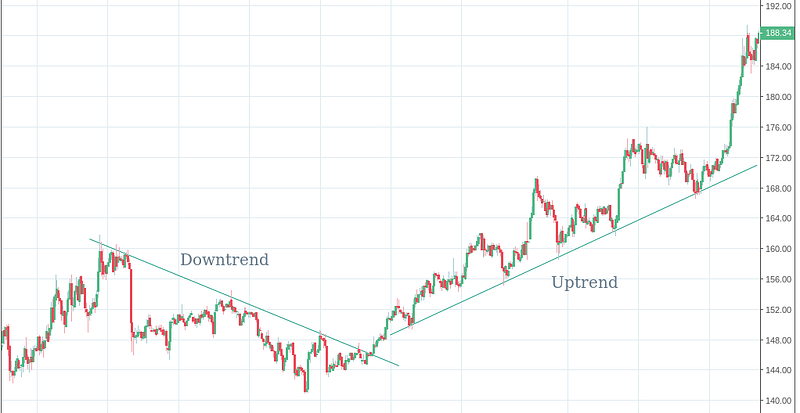
A trend is said to have developed when the price is showing a clear upward or downward movement. The image above shows a bullish and bearish trend. A downtrend is characterized by the formation of lower highs and uptrend is characterized by higher lows formation. Going forward, we will discuss the indicators that can help to identify trend and direction of the trend.
Indicator 1: ADX Indicator
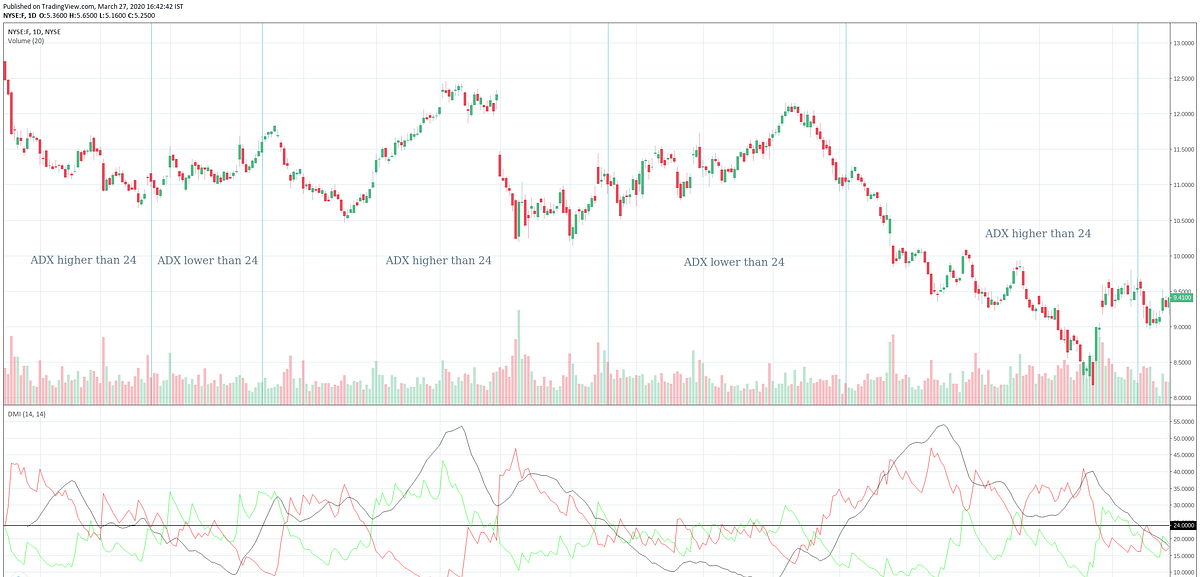
ADX stands for Average Directional Index. It’s one of the most popular indicators used to identify a trend. Unlike most trend-following indicators, ADX is not overlaid over the price but plotted below the price chart. ADX indicator consists of three lines. The ADX (Black), +DI (Green) and -DI (Red) lines. The ADX line is used to determine if any trend exists and the +DI and -DI lines are used to check for the direction of the trend as the ADX line can only identify if any trend exists but cannot identify the direction.
If ADX is higher than 24, it is considered that the stock is undergoing a strong trend. It could be either bullish or bearish and if +DI line is higher than -DI, the trend is bullish and if -DI is higher than +DI, the trend is bearish.
Trend Identification & Signals using ADX:
Bullish: When ADX is higher than 24 and +DI is higher than -DI
Bearish: When ADX is higher than 24 and -DI is higher than +DI
Buy Signal: When ADX is higher than 24 and +DI crosses above -DI
Sell Signal: When ADX is higher than 24 and -DI crosses above +DI
Indicator 2: Moving Averages
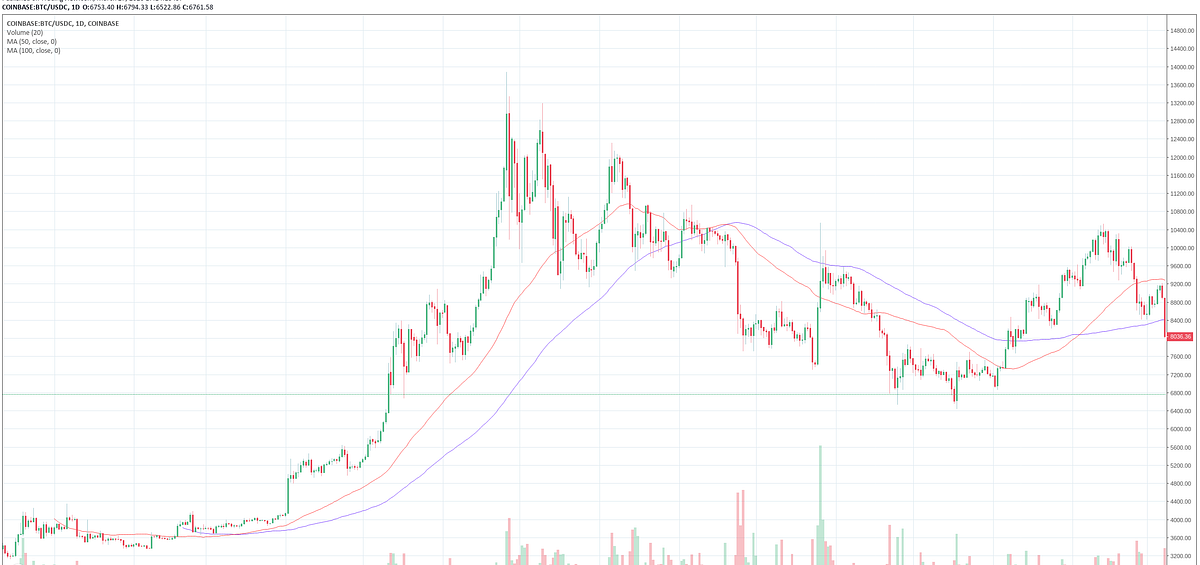
Moving averages are one of the most basic and oldest indicators used by technical analysts. There are a variety of different moving averages each having their own advantages and disadvantages however all of them are used in a similar manner. All the moving averages are used to smooth out price data to remove noise. However, due to smoothing, a lag is introduced. Due to lag, the moving averages react a little later than the price itself. The higher the period of the moving average, the higher is the lag. Eg. In the above image, the red line indicates 50 period SMA (Simple Moving Average) and the blue line is the 100 period SMA.
As we can see in the charts, SMA 50 turns down earlier then the SMA 100 turns when a downtrend begins towards the middle of the chart. For the same reason, when two moving averages are plotted together, the one with lower period is referred to as the fast moving average and the one with the higher period is referred to as slower moving average. Generally 1, 2 or 3 moving averages are used at once by traders.
Trend Identification & Signals using Moving Averages:
Bullish: When price is higher than moving average or when faster moving average is higher than slower moving average.
Bearish: When price is lower than moving average or when faster moving average is lower than slower moving average.
Buy Signal: When price crosses above moving average or when faster moving average crosses above slower moving average.
Sell Signal: When price crosses blow moving average or when faster moving average crosses below slower moving average.
Indicator 3: Supertrend Indicator
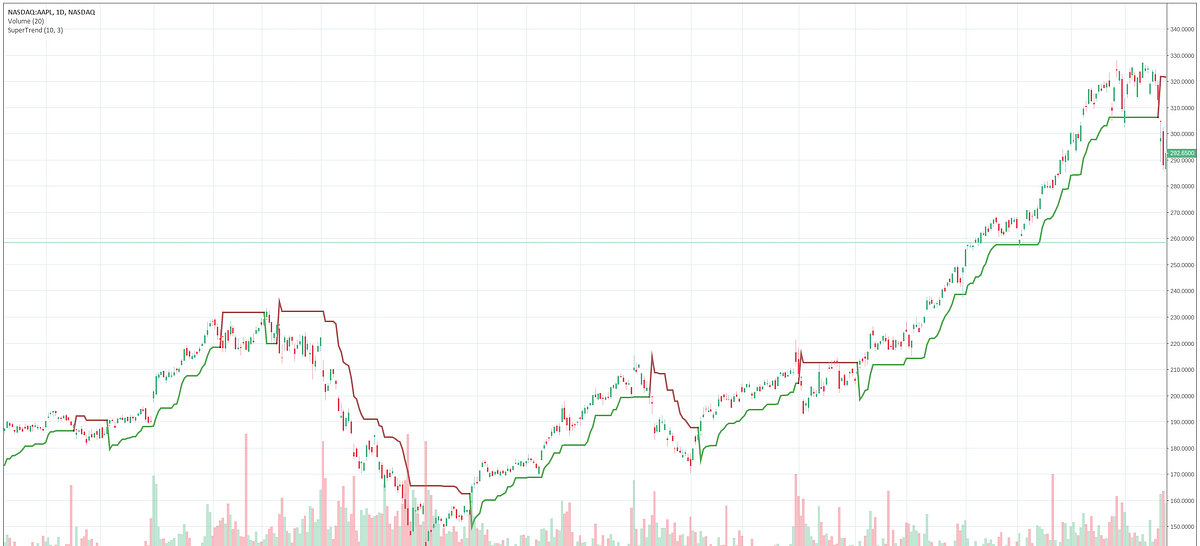
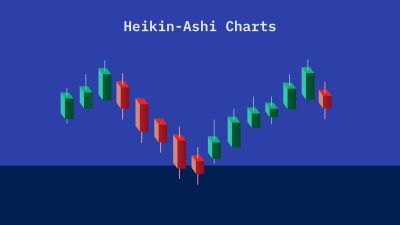
Supertrend is not a very popular indicator but it is one of the simplest indicators to observe and interpret. Supertrend is an overlay indicator. While it works very well in trending markets, it can generate many false signals in sideways or consolidating markets. Some of the false signals can be removed using Heikin-Ashi chart. It is very versatile as it can be used to identify a trend, generate signals and it can also be used as a trailing stop-loss.
One interesting fact about supertrend is that it dynamically adjusts for changing volatility as it is calculated using ATR or average true range which is a volatility indicator.
Trend Identification & Signals with Supertrend:
Bullish: When Supertrend color is green.
Bearish: When Supertrend color is red.
Buy Signal: When price crosses above Supertrend Indicator.
Sell Signal: When price crosses below Supertrend Indicator.
Indicator 4: Parabolic SAR Indicator
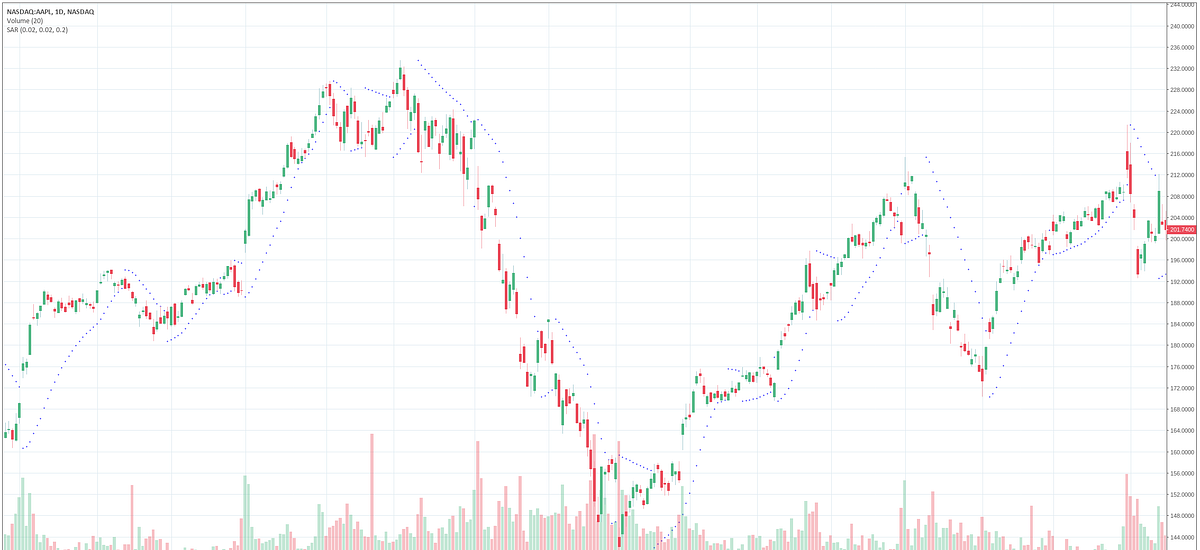
To avoid false trades in a consolidation phase, Wilder suggested that it should be used with other indicators like ADX which helps in identifying trending markets. ADX has already been discussed above. PSAR can also be used as a trailing stop-loss.
Trend Identification & Signals with Parabolic SAR:
Bullish: When PSAR is below Price.
Bearish: When PSAR is above Price.
Buy Signal: When price crosses above PSAR Indicator.
Sell Signal: When price crosses below PSAR Indicator.
Indicator 5: Ichimoku Indicator

Ichimoku Indicator can be very overwhelming to look at due to 5 different lines that are overlaid over the price consisting of various different colors. The indicator is so versatile that this indicator itself can be used to identify support/resistance levels, momentum, trend and generate buy/sell signals however we will be discussing only the trend following aspect.
The lines in the Ichimoku have both Japanese and English names. In this post, we will be using the English names to refer the lines. The cloud (Green and Red Regions) consists of Leading Span A and Leading Span B. Then the Leading Span A is above Leading Span B. the cloud is green. The lagging span is simply the latest closing price plotted 26 periods back. To generate signals, Convention line and base line are generally used. One very interesting thing about the indicator is that the cloud is plotted 26 periods in the future to find future support/resistance levels. The indicator is so versatile that it needs a post of its own for a detailed explanation. We will cover the details, calculations, and specifications in my future posts.
Trend Identification & Signals with Ichimoku Indicator:
Bullish: When Cloud is Green and Price is above the cloud.
Bearish: When Cloud is Red and Price is below the cloud.
Buy Signal: When convention line crosses below the base line OR when price crosses above the cloud.
Sell Signal: When convention line crosses below the base line OR when price crosses below the cloud.
Since it is a very versatile indicator, there can be various different ways to generate signals using different combinations of the lines. The discussed points are the most common ways to use the indicator.
Conclusion :
Though the market is under consolidation majority of the time, the trending market gives an opportunity to capture big moves that can cover the small losses incurred during consolidation as well as generate profits. We have discussed 5 popular trend-following indicators and various ways to identify trend and generate signals.
These indicators can either be used individually or used in combination with other indicators as we discussed for PSAR to generate trading strategies. All the charts are generated using Streak. The platform also offers a very simple interface to create, backtest and deploy strategies with these and various other indicators without coding or buying any data.
Disclaimer: The information provided is solely for educational purposes and does not constitute a recommendation to buy, sell or otherwise deal in investments.


Need more such knowledge updates on the indicators and their teaming up together in different market situations – bullish, bearish, range bound etc.
Hi Chandan,
Yes, we are going to cover indicators, trading types, various approaches, with examples and results in the blog going forward.
Make sure to subscribe to the mailing list to not miss and update and share with your friends 🙂
Pingback: Ichimoku Cloud Simplified: Lagging Span and Look-ahead Bias
Trend Identification & Signals with Ichimoku Indicator:
Bullish: When Cloud is Green and Price is above the cloud.
Bearish: When Cloud is Red and Price is below the cloud.
Buy Signal: When convention line crosses below the base line OR when price crosses above the cloud.
Sell Signal: When convention line crosses below the base line OR when price crosses below the cloud.
Is it not that BUY signal when conversion (not Convention) line crosses above the base line???