Did you know, our system of minutes, hours, and days has been with us since ancient times when people developed it based on a simple base-12 counting system.
- There are 3 joints in each of 4 fingers.
- You can count twelve by tapping each joint with the thumb on the same hand.
- When you reach a total of twelve, you lift one of your fingers or thumb on the hand.
- The cycle repeats itself for times until a total of 60 is reached, which is the number of seconds in a minute, and the number of minutes in an hour
That’s interesting. Moving on to the world of trading!
Markets consist of a series of events. These events usually occur in sequences, that is, they happen one after another. But there are loads of them. An active market might have millions of transactions occurring in a single day and hundreds of millions in an entire year. Now, this is a hassle for a trader or an analyst!
How can we possibly make sense of such an enormous amount of data? How do we make it meaningful in an efficient way? Of course, it is possible to analyze the market on an event basis, that is, tick-by-tick, or order-by-order. This analysis requires significant computing power and is largely impossible to inspect visually.
Enter Time-Intervals!
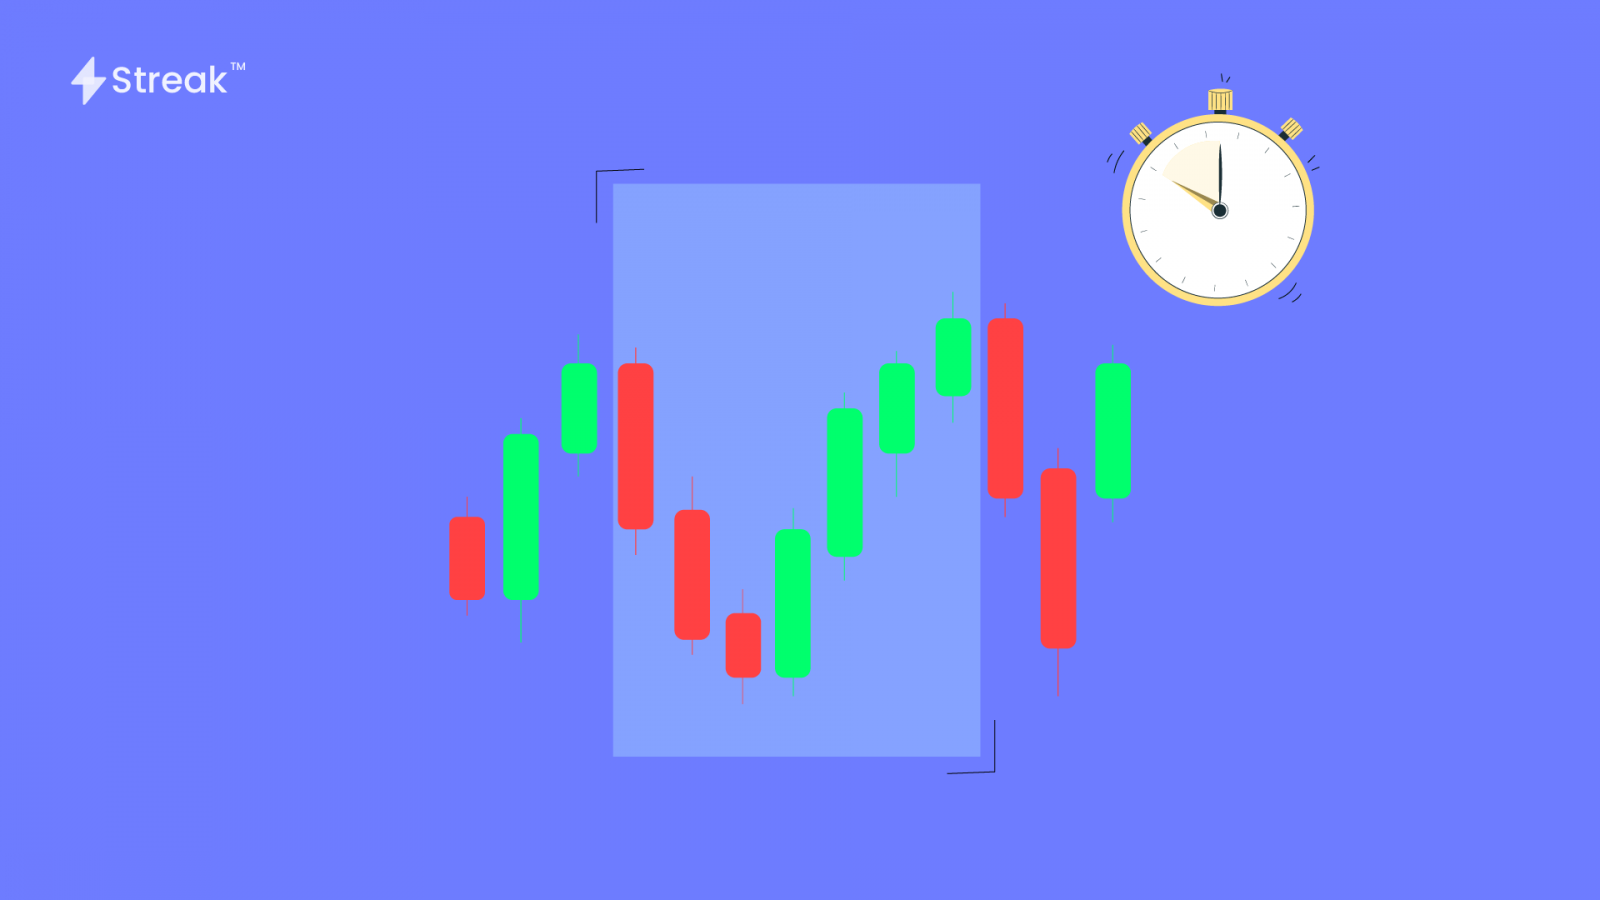
The answer to the above problem is ‘grouping’ or ‘categorizing.’ After grouping, we can ‘summarize’ their most important or interesting characteristics. Once we have all this, we analyze the summaries rather than the events themselves. This leads us to the familiar concept of Open-High-Low-Close (OHLC) bar or candle that we see in the typical price chart.
We could also report the mean price of all the transactions if we wished, as well as any other statistical calculations which might be helpful.
Is Summarizing the Ultimate Solution?
No. Everything comes with drawbacks. Now consider you are using summary data in our analysis, for example, the OHLC bar from the daily chart. From potentially millions of events that occurred during the day, we derive only 4 values – the price of the first and last transactions of the day, as well as the highest and lowest prices of the day. That’s useful, but it also results in information loss. We might be able to infer certain possible trends or somewhat gauge the market conditions, but we can’t be sure exactly how the events unfolded. Furthermore, OHLC bars also summarise the overnight session into 2 data points – the close of one bar and the open of the next. But again, we don’t get any detail.
Now that you have imperfect information, you have to rely on assumptions. For example, you buy a stock and set the stop loss and target profit levels of the trade within the low and high of the bar respectively.
This concept also extends to intra-day time periods.
We typically summarize hourly data into hours that start and end strictly on the hour. Is there any principle related to the underlying market phenomena guiding this decision? Is it something that we’ve just taken for granted without giving it much thought? What impact might THIS have on our trading and assumptions?
Shifting Time Frames to Better Understanding
One important consequence of this nature of our time frames is that we can pick another different time frame to test various hypotheses. This can also be used to generate more and various forms of data.
For example, say we are using an hourly time frame to research our trading idea. We think that the price is going up (Let’s assume we see are looking at the time period from 10:00 am to 1:00 pm. These three candles are showing an uptrend ) and we can take a buy position. Yes, we found an edge. Now, we can validate our idea by using a minute time frame for the same period of time, that is, between 10 am to 1 pm. If the price is still showing an uptrend, then we can be a little more confident about our idea!
Final Thoughts
From the above, it can be concluded that assumptions should always be tested. The use of hours, minutes, and seconds to summarize our data is so fundamental to our view of the world, that we don’t even realize we’re making them. Thinking about these assumptions can not only lead to deeper insights into the nature of the markets but also reveal creative research techniques.


