Every candlestick gives us an insight about the market. Most of the new traders are aware about doji and spinning top candlestick patterns. However not many are aware about High Wave candles. The body of a high wave candlestick is small to medium in size, with lengthy upper wicks and shadows. Similar to doji and spinning tops, they signify indecision in the market. It indicates that the market might change direction. In this article, we will learn about the high wave candle and also learn how to develop trading strategies on the Streak platform using the concepts.
What is a high wave candle?
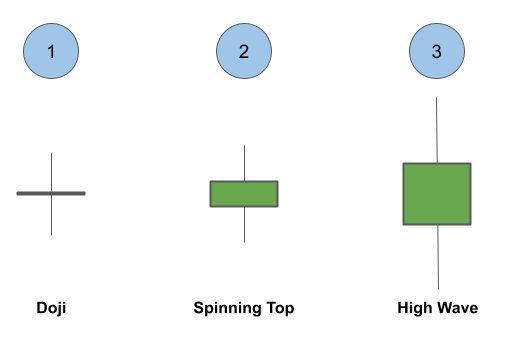
A high wave candle consists of a smaller body with large upper and lower wicks.
As we can see in the image above, doji has large wicks as compared to the body but the size of the body is almost negligible. The upper and lower wicks of a spinning top are short as compared to a high wave candle, whereas the upper and lower wicks of a high wave candlestick are somewhat long. This is due to higher volatility during the formation of the high wave candle. A high wave’s real body can be larger than a spinning top’s real body.
Like doji and spinning tops, high wave candles can appear anywhere on the chart. However, they become meaningful only if they are near support/resistance level following a prior up trend or down trend. The color of the candle can be red or green.
Why does it imply indecision?
We have seen that the wicks of the high wave candle are very long as compared to the body. That means the high and low made during the candle formation are very much apart from the open and low prices. From this we can infer that the bulls and bears both tried to move the prices in their preferred direction but none was able to sustain their move and the market ended up closing very close to the open.
Scanning for Stocks forming High Wave Candle
The below scanner on Streak platform will let you scan for stocks where a high wave candle has been formed:

Check out the complete interactive scanner: https://public.streak.tech/in/l3V9Fp49YS
The following logic has been used to create this scanner:
- The body should be between 10-20% of the high-low range
- High-Open should be at least twice the size of the body
- Open-Low should be at least twice the size of the body
Creating Strategies with High Wave Candle on Streak
In this section we will use the same logic that we used in scanner to create the High Wave Candle and add one additional entry condition to create the strategy. Here are the conditions of the strategy:
Entry Condition: Previous 1 hour candle was a high wave candle AND the current candle closed above the high of the previous candle.
Exit Condition: 2% Stop-loss is hit OR 4% Target is hit.
It is a CNC strategy, which means the position will be carried overnight.

Check out the complete interactive Strategy: https://public.streak.tech/in/zkd5159LCV
Conclusion
The high wave candle is a very easily recognizable candlestick pattern. It is important to remember that it only serves as a warning for reversal and traders must look for other confirmations or signals to enter a trade. To improve the performance of the strategy, traders may look to include other conditions such as prior trend, support and resistance etc.
Disclaimer: The information provided is solely for educational purposes and does not constitute a recommendation to buy, sell, or otherwise deal in investments.


