One of the very important market characteristics that a trader must understand is volatility as it helps in understanding the extent of movement that can be expected from the market. In the simplest language, volatility is how quickly the market is moving. The movement can be in either direction. When the volatility is high, traders can expect to see huge swings in the market. Stocks with very high volatility are generally considered more risky.
Volatility is also cyclical. Market goes through periods of high and low volatility. In this article, we will learn about various popular indicators that can be used to measure historical volatility in the market.
1) Average True Range

The indicator was originally developed by J. Welles Wilder, Jr. for commodities markets. The average true range is an N-period smoothed moving average of the true range values. Most commonly, 14 period ATR is used. A shorter period for the indicator can be used to measure most recent volatility and a higher period can be used to measure longer term volatility.
It is important to note that the ATR indicator does not tell anything about the direction of the market. The value of ATR will vary from stock to stock and for different time frames. Traders should compare the ATR value with the historical ATR value to detect a spike in volatility.
2) Bollinger Bandwidth Indicator

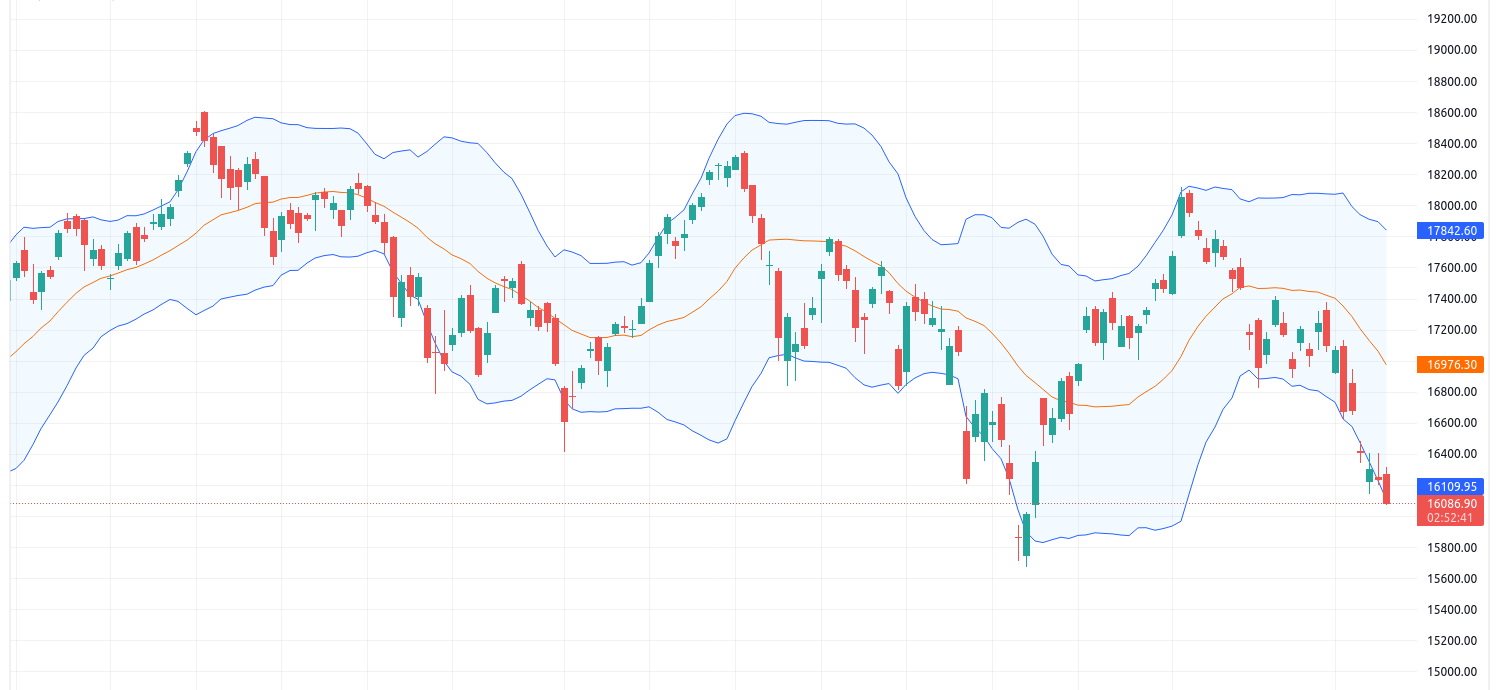
The Bollinger Bandwidth Indicator is derived from the Bollinger Band Indicator. It measures the separation between the upper and the lower bands. BandWidth decreases as bollinger bands narrow and increases as bollinger bands widen. As we know that the bollinger bands widen when the prices are moving fiercely, increasing bollinger bandwidth value indicates a rise in volatility and falling value of this indicator indicates a drop in volatility. Like the ATR indicator, this indicator also gives no information about the direction of the market.
3) India VIX Index
The indicators that we have seen until now are used to measure the historical volatility or the volatility that has already occurred in the market. This index shows the market’s expectation of the volatility over the near term i.e the future volatility. VIX index is calculated from the bid ask prices of the NIFTY 50 options contracts. India VIX indicates the expected market volatility over the next 30 calendar days in annualized form. A high VIX value indicates that the market is expecting a higher volatility in future and vice versa. Historically, the India VIX index has lied between 10 and 40 levels most of the times. Traders must compare the current value of VIX with historical values to check for high/low volatility. A value higher than 25 can be considered as high and a value lower than 15 can be considered as low.
Strategy Example on Streak:
In this strategy example, we will demonstrate how we can use volatility indicators in our strategy. More often than not, volatility spikes when the markets are falling as there is a lot of panic in the market when the market falls. We have used the same theory in our strategy.
We have used bollinger bandwidth indicator to gauze volatility by comparing the indicator value with its historical values. The following are the entry and exit conditions:
Entry: Sell when Bollinger Bandwidth Crosses above the highest value in last 30 candles (Spike in volatility) AND Close of candle is lower than Supertrend (The trend is bearish).
Exit: 1% Stoploss is hit or 2% Target is hit.
Conclusion:
Volatility is one of the very important characteristics. There are various indicators that can help you gauze market volatility. Streak platform provides wide range of these indicators that can be used to create and backtest trading strategies and live trade with them.
Disclaimer: The information provided is solely for educational purposes and does not constitute a recommendation to buy, sell, or otherwise deal in investments.


