The proof of pudding is in eating and this should rightly be the approach for anyone involved in the capital market. Being skeptical about matters related to money would help in preventing another Jamtara.
In my last article, I explained how to use Supertrend and create profitable trading strategies in Streak. I also discussed the different metrics available in the backtest result briefly. In this article, we will discuss how to interpret the transaction details and verify backtest results.
But before that, let us take a look at a candlestick first and understand what it depicts.
Candlestick formation
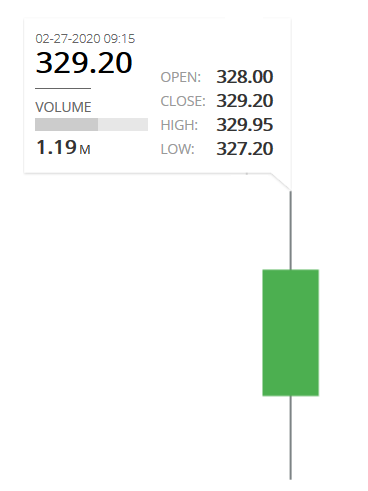
A candlestick is a chart type that displays four price information namely Open(O), High(H), Low(L) and Close(C) along with a date and time.

So, the candle in the figure is basically a summary picture of all the price action that took place in 3 min from 9:15 AM till 9:18 AM on 27th February 2020.
Open: Open price displays the price at which a transaction took place at the open of the candle i.e 9:15 AM.
High: This displays the highest price, from 9:15 AM to 9:18 AM, at which a transaction took place.
Low: Similarly, the Low price displays the lowest price at which a transaction took place.
Close: The last price at which a transaction took place at 9:18 AM. Close price of a candle is perhaps one of the most important price information since most of the technical indicators are calculated using Close price of a candle.
Simple right?
However, if you have ever wondered how it would look like if LTP (last traded price) is plotted, you can refer to the following image.

Now that we have understood what a candle depicts, let us jump in and understand transaction details in the backtest result.
How to interpret transaction details
Consider the following transaction details

The first line in the chart has EN trigger type and it means that all my entry conditions were met at the close of the 9:15 AM candle and a BUY position was executed at INR 342.20. Most people would assume that this means that the trade was taken at 9:15 AM. However, that is incorrect. At 9:15 AM, the market(NSE) opens and no transactions could have taken place before that. So, no candle could have formed at 9:15 AM.
So then what does this mean..?
Well.. the 9:15 AM mentioned in the table is trying to convey that at 9:15 AM, the trigger candle opened and it closed at 9:18 AM (since we are using 3 min timeframe). And then after the candle closed, the strategy conditions were checked by the system. All the entry conditions were met and hence an entry position was assumed to have taken.
The transaction table basically lists the opening time of all the candles that matched the conditions mentioned in the strategy. But, it is important to note that triggers can only get generated after the candle closes i.e, after the complete formation of that candle. To put it simply, all price information of candles i.e O, H, L and C are required for checking and trigger generation.
I hope you are with me on this. Now let us look at the trigger price. i.e INR 342.20

We have already established triggers are generated after the Close price of a candle is available. Now, the price at which any trade gets executed will be slightly or in some cases significantly different from the Close price of the qualifier candle. Hence the Open price of the next candle is considered, to account for the lowest slippage and show best-case scenario.
It is important to understand that the price at which triggers are generated, which is Close price, in this case, has already become historical information. And considering historical price as the trigger price is impractical.

So… next time, when you look at the transaction table, you’ll get all key insights and a better perspective on optimizing the strategy.
More on transaction details
You can access the transaction details for every backtest by clicking on “Transaction Details ”.

Transaction details contain the following information

Trigger Date, Instrument, Buy/Sell (position), Quantity, Price, Cumulative P/L and Trigger type
Let us now understand each item.
Trigger Date: This is the time when your strategy conditions were met. Trigger time states the “Open” time of the candle, which matches all the conditions in the strategy.
Instrument: The name of the instrument on which you backtested the strategy.
Buy/Sell: The type of position taken after the strategy conditions were met.
Quantity: The number of stocks that were transacted.
Cumulative P/L: The total profit or loss accumulated, so far, after the transaction.
Trigger type: There are 5 trigger types available in Streak
a. EN: Entry
b. EX: Exit
c. TP: Target Profit
d. SL: Stop Loss
e. SO: Square off: All intraday positions for MIS strategies are assumed to be exited by 3:15 PM
I hope this blog was of some help. Also, you can refer to the Streak help if you need more information about the platform.


