When it comes to technical analysis, one of the most important concepts to understand is volume. Volume (Vol.) is simply the number of shares or contracts traded in a security or market during a given period of time. It is a valuable tool that can be used to identify trends, reversals, and continuation patterns.
Volume is the only raw data available on charts apart from the price, hence it becomes important for traders to learn to interpret it. Volume indicators are formed by manipulating the volume data. These indicators make the volume data more meaningful and give it a new dimension.
What is Volume?
Buyers and sellers make up the market. A transaction can only take place if both parties agree on a price. If there is a transaction of one share between them, the vol. has grown by one. Volumes may also be seen in the derivative markets. One unit of volume in the derivative markets indicates a trade of one contract or lot.
Klinger Volume Oscillator
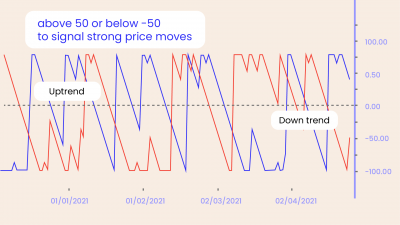
Stephen Klinger created the Klinger oscillator to establish the long-term trend of money flow. It is also sensitive enough to detect short-term changes. The indicator analyses the vol. moving through stocks to the price fluctuations , and then transforms the result into an oscillator.
The indicator should be used with other trading techniques such as trendlines, moving averages, patterns, breakouts etc.
Like bollinger bands, the indicator consists of the oscillator, its moving average (signal line) and a histogram. The histogram might not be available on all the platforms. The oscillator being above the 0 line and the signal line is a sign of bullishness and the oscillator being below the 0 line and the signal line is a sign of bearishness.
The histogram represents the distance between the oscillator and the signal line. It is also worth noting that the indicator has many whipsaws.
Moving Average Volume
This is the most basic type of vol. indicator. It works similar to the moving average that we are all used to on price. The Vol. moving average shows the average volume of a security over a specified period. All the different types of moving averages such as SMA, DEMA, TMA can be applied over volume as well.
This indicator is used to smoothen out the volume data, to filter out short term spikes and to compare the current vol. with the historical average to check if the current volume is higher or lower. You can also check if the moving average is trending up or down in order to check for generally rising or falling volumes.
On Balance Volume
The OBV indicator is shown underneath the price. The indicator correlates vol. flow to price fluctuations in the stock. The indicator is created by adding the sum of positive and negative volumes. The indicator is used to confirm price change. If the price makes a new high, the OBV must likewise reach a new high; otherwise, a condition of divergence is developed, indicating a probable reversal.
In the above image, the price has made a lower low but the OBV indicator failed to make a lower low creating a bullish divergence following which the price started advancing.
Strategy Example:
Strategy Link: https://public.streak.tech/in/tuqnrnARxu
The strategy takes a buy position when the Klinger Volume oscillator crosses above the signal line and the next candlestick closes above the high of the crossover candle. The exit is based on fixed percentage based stoploss and target.
Conclusion
Vol. is simply the number of shares or contracts traded in a security or market. It is a valuable tool that can be used to identify trends, reversals, and continuation patterns. Volumes may also be seen in the derivative markets where one unit of vol. indicates a trade of one contract or lot. We have discussed three indicators that can be used to incorporate vol. data in strategies, each having different interpretations. Strategies can be developed with various vol. indicators available on the Streak platform.
Disclaimer: The information provided is solely for educational purposes and does not constitute a recommendation to buy, sell, or otherwise deal in investments.


