Traders often wonder how to avoid sideways markets. In this article, we will discuss a Technical indicator that can help you do just that – the Choppiness Index (CI). Developed by E.W. “Bill” Dreiss, a commodity trader from Australia, this indicator measures price volatility in a market.
What is the Choppiness Index:
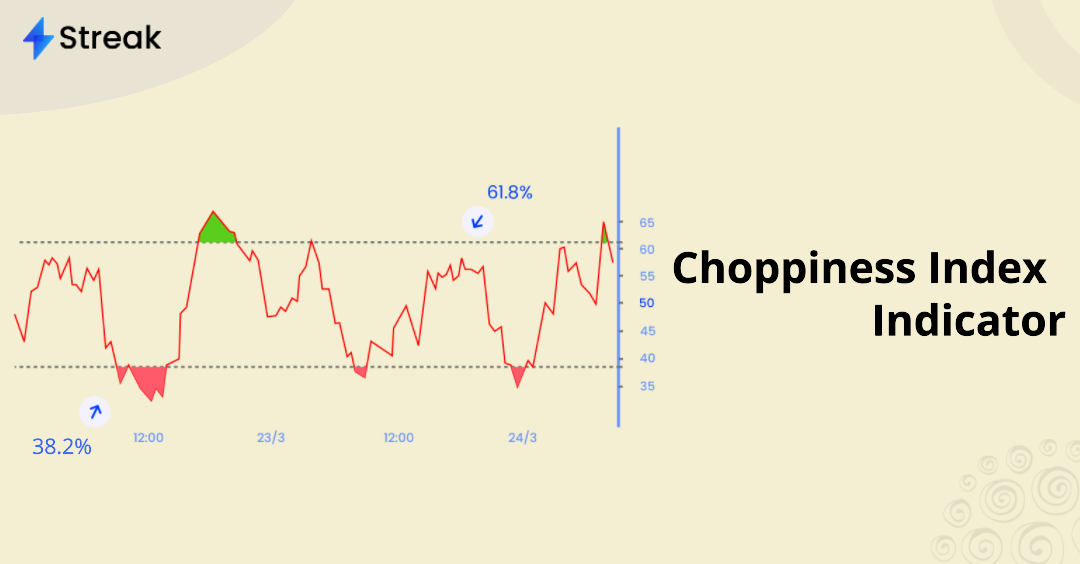
The Choppiness Index (CI) is an oscillator that measures the directionality of a market versus its choppiness and is used to distinguish a trending market from a choppy/rangebound movement. It is calculated by dividing the Average True Range (ATR) by the total price range of the selected period. Low CI values indicate a strong trend and high values signal consolidation.
Formula:
Here is the formula for calculating the Choppiness Index:
Choppiness Index = 100 * ATR(n) / (Highest High(n) – Lowest Low(n))
ATR = Average True Range of n periods
Highest High(n) = Highest high price of n periods
Lowest Low(n) = Lowest low price of n periods
n = period for calculating the Choppiness Index

The default parameter value is 14.
Interpretation:
The Choppiness Index can range from 0 to 100 and lower values indicate that the market is trending, while a high Choppiness Index indicates that the market is range bound. Generally, a CI value of 61.8 or higher is considered to be choppy and a CI value of 38.2 or lower is considered to be trending.

Here are some general interpretations of the Choppiness Index:
- Low values (0-30): The market is trending and prices are moving in a relatively narrow range. This is a good time to trade with the trend.
- Medium values (30-70): The market is neither trending nor ranging. This is a time to be cautious and to avoid taking a large position.
- High values (70-100): The market is ranging and prices are moving in a wide range. The market is likely to be volatile.
Since the Choppiness Index cannot determine market direction, it does not indicate in which direction to expect the breakout, but that the breakout will probably be followed by a significant move.
How to use the Choppiness Index:
Here are some specific examples of how the Choppiness Index can be used:
Identify choppy markets: It can be used to identify choppy markets by looking for periods where the CI is high. A high CI indicates that the market is very volatile and that the price is moving in an erratic manner while a high value indicates that the market is range bound.
Volatility Assessment: The CI can be used to identify trending markets by looking for periods where the CI is low. A low CI indicates that the market is not very volatile and that the price is moving in a relatively consistent direction.
Trend Confirmation: This can be used to confirm potential trends by looking for periods where the CI value is lower. For example, if the CI is low and the price starts to move down, it could be a sign that a downtrend may begin.

Sample Strategy:
Let us now create a trend-following Long strategy in Streak using the concepts discussed above.
Entry: I will enter a long position when the Supertrend indicator gives a buy signal and the current value of the Choppiness Index is lower than 38.2. Here is a snapshot of the conditions:

Exit: I will Exit my position when the Supertrend indicator gives a bearish signal or at a Stop Loss of 3% and 30%.

Here are the backtest results on a few random stocks:
You can access the backtest result, copy the strategy, and modify the logic on any stock of your choice.
Conclusion:
While the Choppiness Index is a useful tool, for understanding the trendiness, it cannot identify the direction. It should be used in combination with other indicators to understand the direction. It is a Lagging indicator that can give false signals in illiquid markets. You need to backtest your strategies thoroughly before using them in the live market.
Disclaimer: The information provided is solely for educational purposes and does not constitute a recommendation to buy, sell, or otherwise deal in investments.


