Introduction :
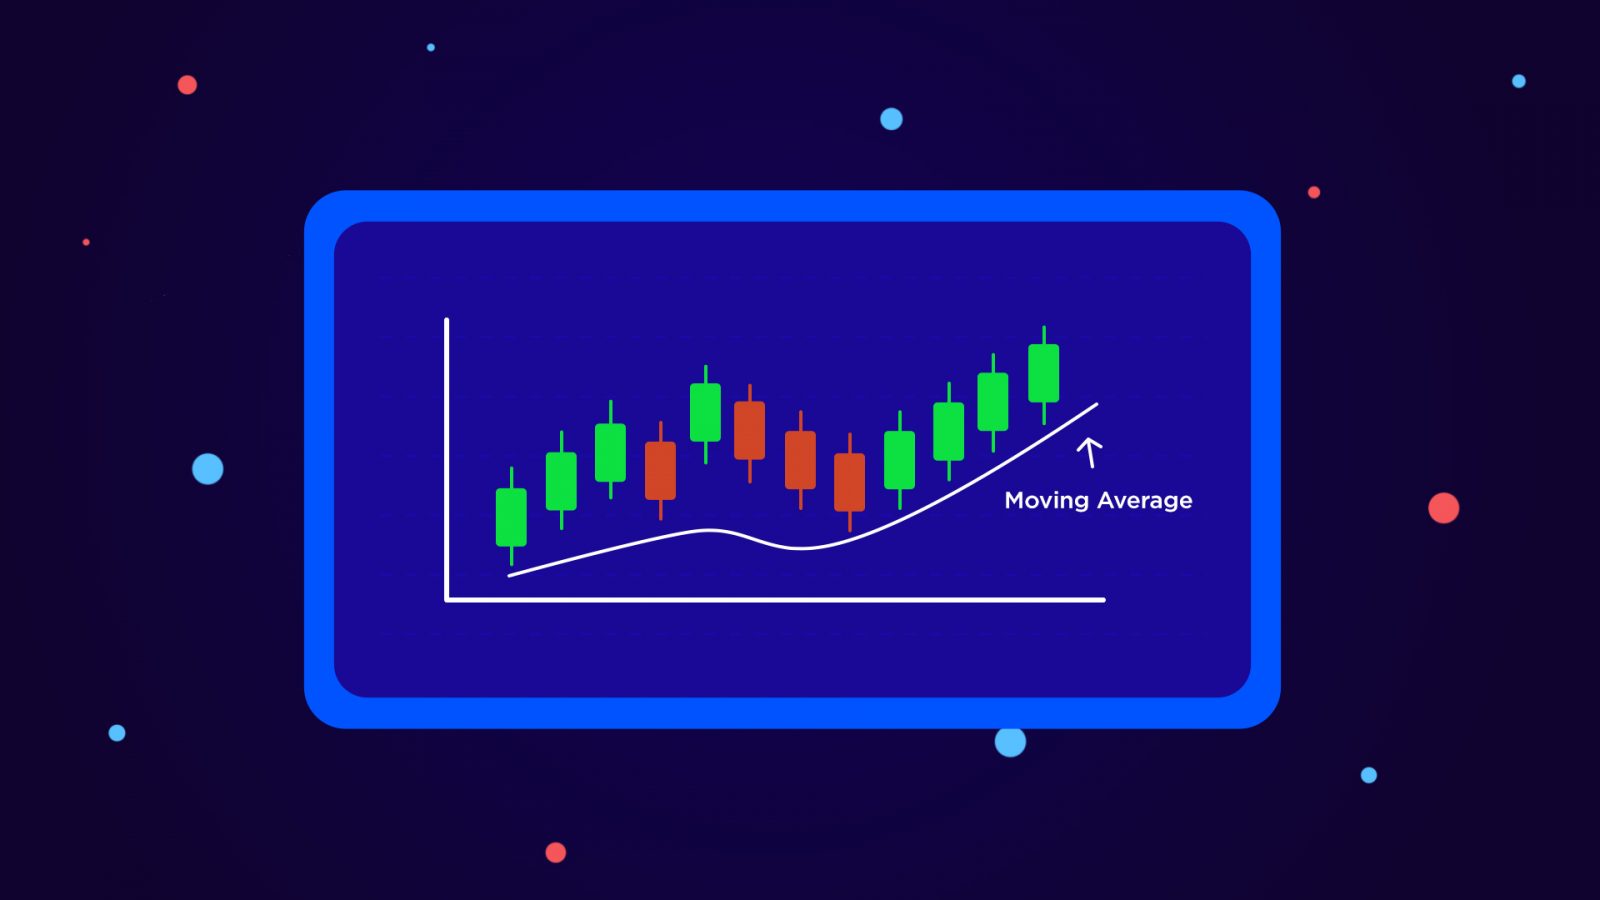
Moving Averages are one of the simplest indicators to understand, calculate, and use. They have been around for a very long time. Moving Averages are so versatile that they are often used for calculating other indicators like the Bollinger Bands, Alligator, TRIX, etc.
They are generally trend following and lagging in nature. While there are various different types of averages, the most commonly used ones are SMA and EMA.
What is a Moving Average ? :
Let’s have a look at the calculation of SMA5 :

As we can see, SMA is actually very simple to calculate.
FORMULA = (X1 + X2 + X3 + X4 + Xn)/n
Xn = Price on nth candle
n = period of the SMA (5 in this example).
Let’s see how the calculation will happen once more days are added to the data :

As we can see now, Day 1 and Day 2 data has been replaced by Day 6 and Day 7 data and the yellow region, which represents the data included in calculation has shifted or moved towards the right hence the name, moving average.
Comparing Moving Averages
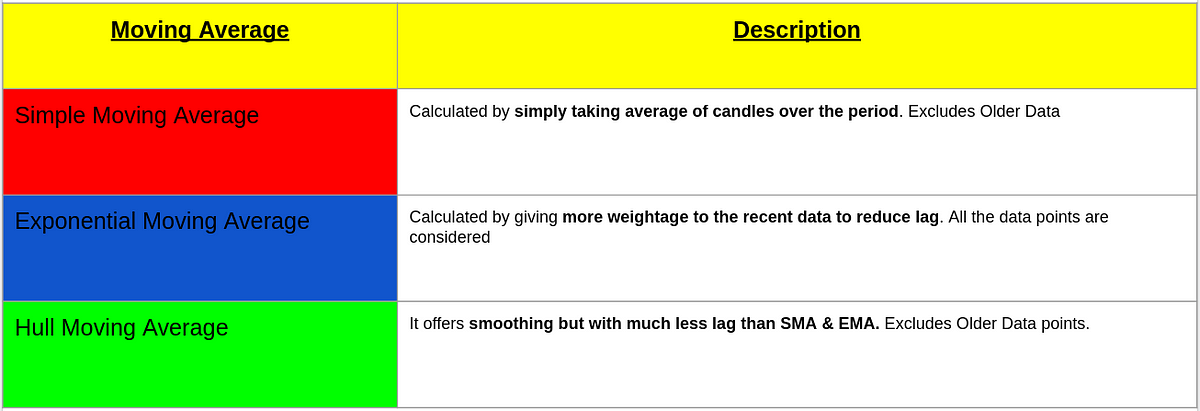
The table below compares 3 of the popularly used moving averages.
Uses of Moving Average
Moving Averages are used to smoothen the price but while doing so, it also induces a lag. They react later than prices. The higher the period of the moving average, the more the smoothening and more the lag. Some averages like SMA exclude the data older than the period of Moving average but others like EMA consider all the data points available even beyond the period since each EMA calculation depends on the previous EMA value.
They can be used to spot trends, generate signals, mean reversion systems, trend following systems and also to calculate other indicators like MACD, Bollinger Bands, Alligator etc. Apart from price, they can also be applied on other indicators like RSI, Volume etc.
Spotting Trends with Moving Averages
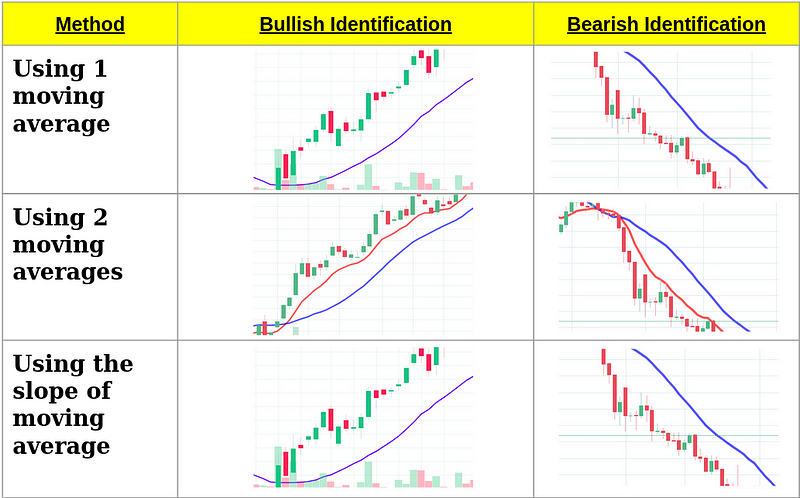
The three common methods to spot trends using moving averages are shown in the above table. We will be discussing the bullish implications, the bearish ones are the opposite.
- Using 1 Moving Average: This is the simplest method of them all. If the market participants are ready to pay a higher than the average price for the stock, the demand is higher and the trend is up.
- Using 2 Moving Averages: Two moving averages are used in this system. One has a longer period and the other has a shorter period. The former is called slow moving average and the latter is the fast-moving average. When the fast-moving average is higher than the slow moving average, it indicates that the trend is bullish. Some traders even use three moving average systems.
- Using Slope of Moving Average: This is a very simple system. It checks the slope of the moving average. The direction of the slope tells the direction of the trend and the angle of the slope can be used to determine the strength of the trend.
Creating Strategies with Moving Averages :
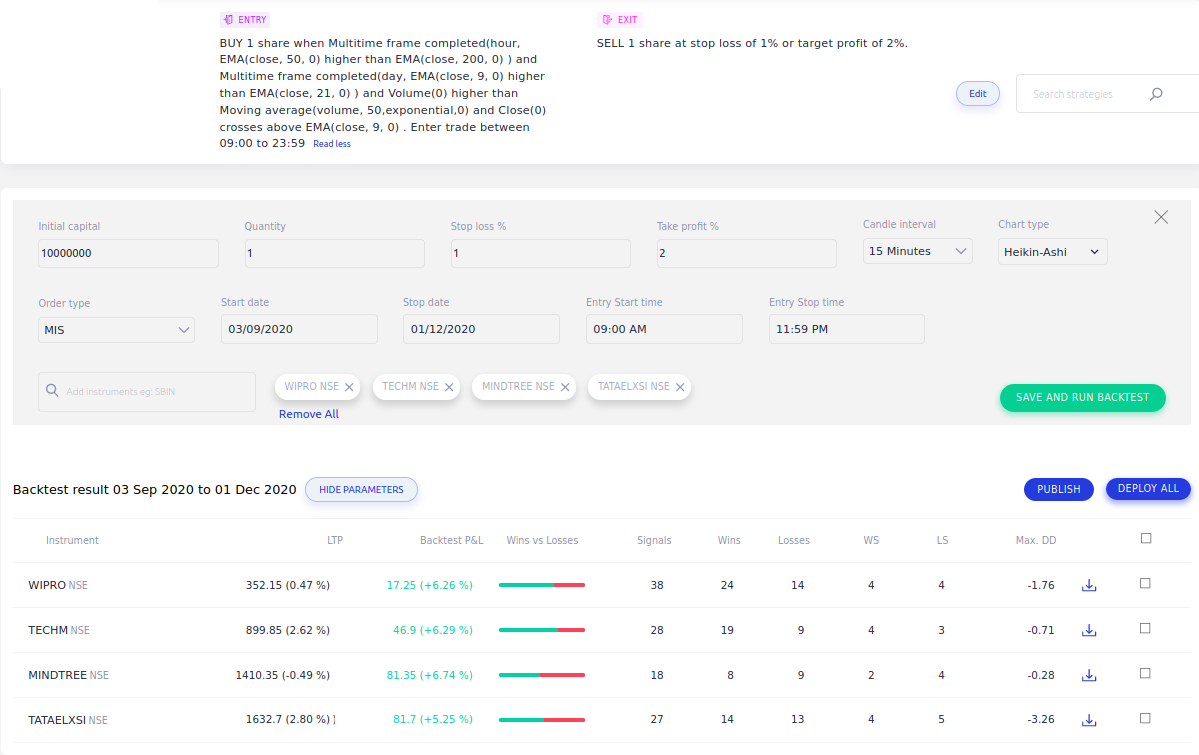
This is a multi-timeframe strategy backtested on Streak. To determine the trend on daily and well as hourly timeframes, we have used MAs on both the timeframes. Using one moving average system on the 15 min timeframe, the entry signal is generated. For extra smoothening, Heikin-Ashi is used. An interesting thing to note here is that the indicator has also been applied on Volume. Likewise, the moving average can be applied to other indicators as well like RSI.
Conclusion :
Moving Averages are very useful and versatile indicators. They can use used on price and other indicators as well. There are some advantages as well as disadvantages. Different types of moving averages have different properties and are suitable for different requirements. You can learn about MA envelopes over here.
Disclaimer: The information provided is solely for educational purposes and does not constitute a recommendation to buy, sell, or otherwise deal in investments.


