Introduction:
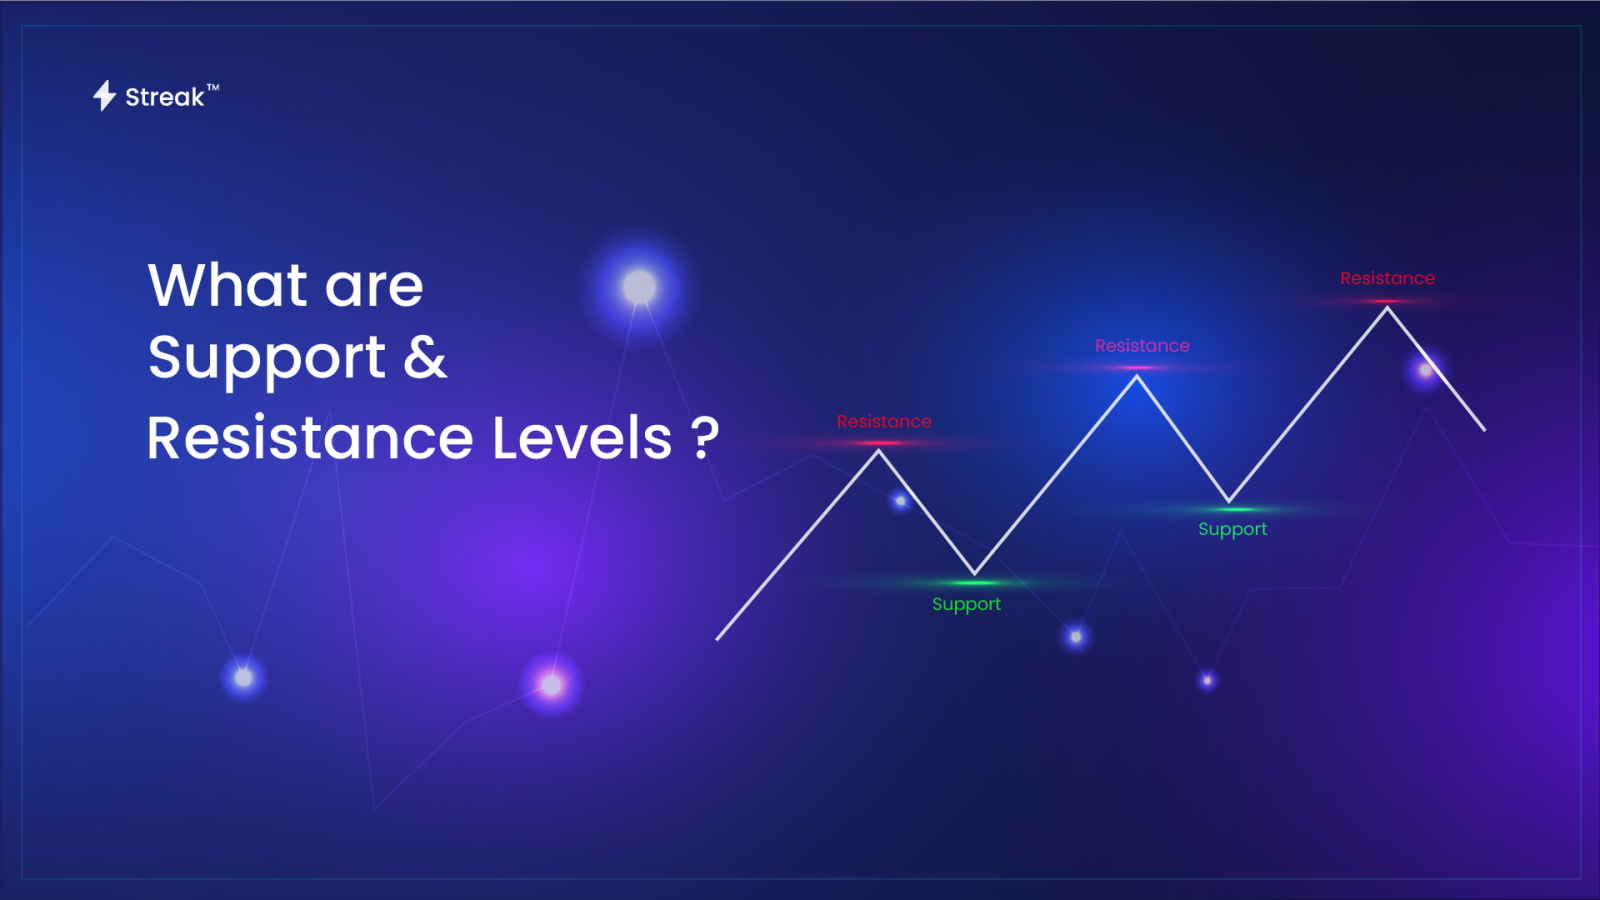
Support and Resistance Levels are important levels where significant moves can develop due to increased buying/selling interest. They can help you identify entry and exit points and can also help identify levels from where prices can reverse or trends can pause. We can also use them as secondary confirmation.
What are Support & Resistance Levels ?
At support levels, traders can expect more buyers than sellers (higher demand) and at resistance levels, traders can expect to see more sellers than buyers (higher supply).
A breakout occurs if instead of bouncing off these levels, the price breaks and moves out of the Support or the Resistance. Going forward, we will see also see an example of resistance breakout strategy.
Types of Support & Resistance:
There are many methods to identify S/R levels. Mainly they can be either static or dynamic. Let’s learn the differences from the below table.
Quickly Spotting Support and Resistance Levels
Streak platform provides you with a visual and intuitive tool to spot the S/R levels. It will also show you the relative position of the price with respect to the S/R levels. It lets you check the support/resistance levels on different timeframes in the quickest time possible. These levels are calculated based on the standard version of the Pivot points indicator which is a very popular indicator amongst day traders. The tool can be found on the homepage of the Streak platform.
Strategy Example
The discover section on Streak has 100+ Strategies created by our experts for educational purposes. In this discover strategy, Buy entry occurs when price crosses above a resistance level supported by volume. We have used previous day’s high as a resistance in this example.

To locate the strategy, you can go to the Strategy Discover section and search for ‘Breakout with Volume’.
Conclusion:
A price point below the current market price that indicates buying interest is referred to as support and a price point above the current market price that indicates selling interest is referred to as resistance. A stock’s price can rise above resistance or fall below support, following a breakout . Furthermore, as a trader, you should not rely solely on these levels to take trades. You should observe price action and indicators like RSI divergence near S/R levels. You should create and backtest different combinations of strategies to check and compare the performances.
Disclaimer: The information provided is solely for educational purposes and does not constitute a recommendation to buy, sell, or otherwise deal in investments.


Pingback: Three popular indicators to spot support and resistance - Streak Tech