Introduction:
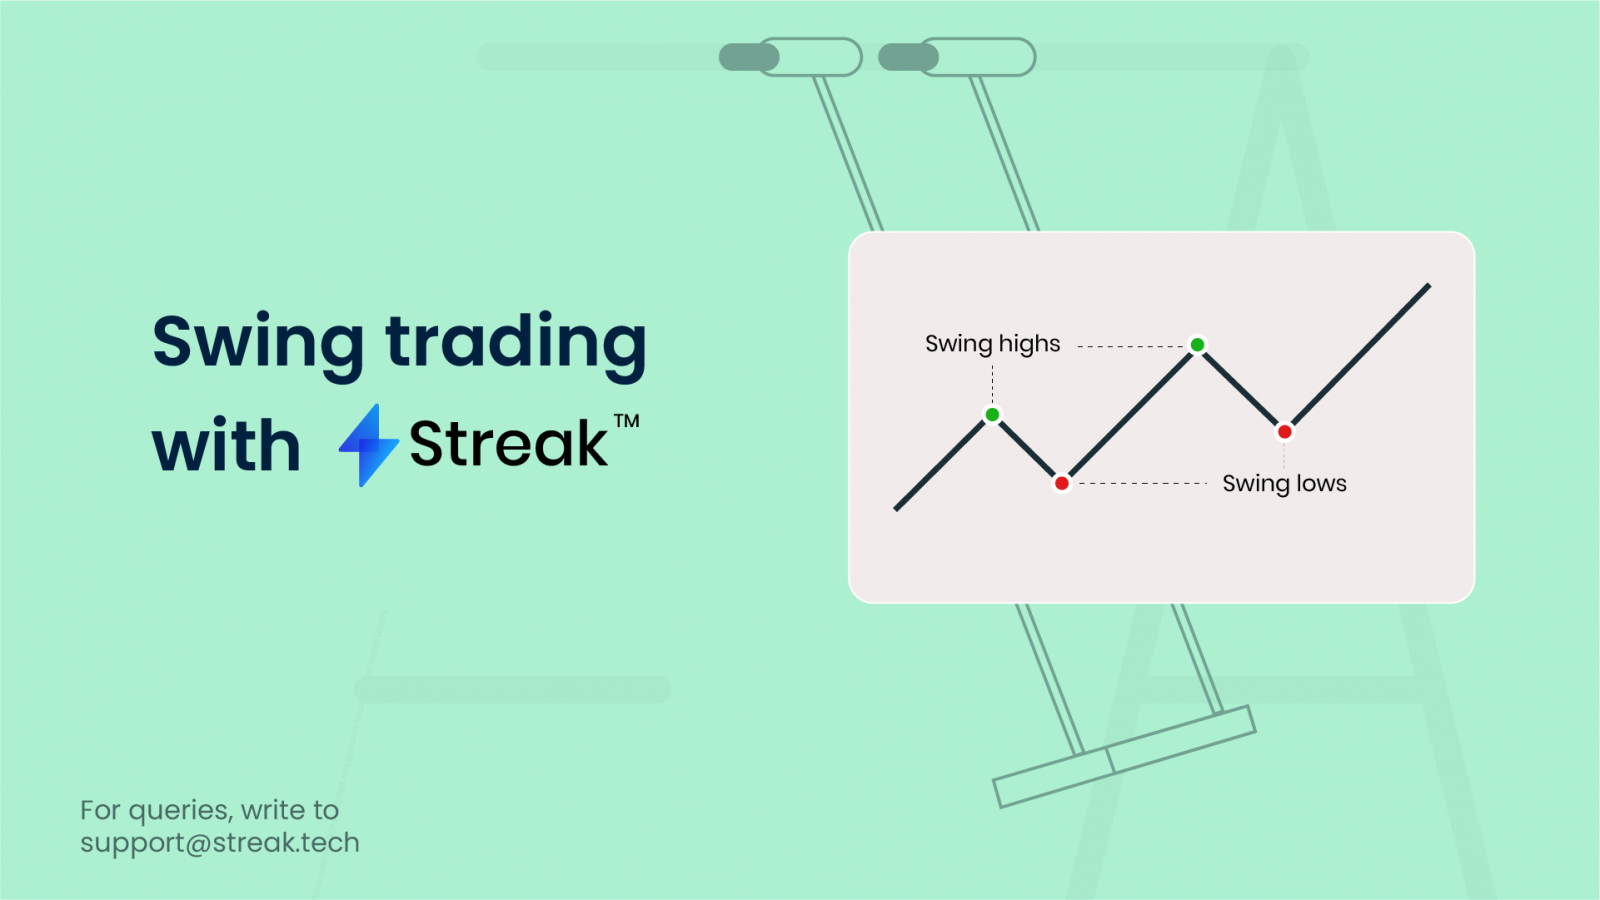
Swing Trading is a widely practiced discipline in the trading community. Swing trading involves taking trades that last a couple of days up to several months in order to profit from an anticipated price move. It is one of the most popular forms of active trading, where traders look for intermediate-term opportunities using various forms of technical analysis.
In this blog, I will be showing you how we can create strategies and scanners for swing trading. I will also be explaining the logic behind the strategies so that you also learn the art of developing your own ones.
What is Swing Trading:
Swing Traders attempt to capture short to medium-term trends. The holding period for swing trading can be from a few days to few weeks. Swing traders primarily use technical analysis, due to the short-term nature of the trades.
Why Learn about Swing Trading:
Compounding returns is easier as profits can be booked and reinvested in the next trade over a couple of days as compared to a buy and hold or long-term investment strategy. It is the more active form of trading than long-term investing but less active as compared to intraday trading. Swing traders use a higher timeframe as compared to intraday traders. Higher time-frames generally have fewer false signals. This means the complexity of the strategy can be less than intraday strategies. Swing traders can avoid taking highly leveraged positions as they focus on capturing higher moves as compared to day traders.
Common Types of Swing Trading Strategies
Some of the most common types of strategies used by swing traders are Mean Reversion, Breakouts, Trend Following and Support & Resistance.


Common Time-frames for Swing Trading
Traders may use daily time-frame for spotting the primary trend.

Traders May use 5 min – 1 hour time-frames for entries and exits

Strategy Example 1:

In this strategy, we are checking the trend on daily timeframe using the ichimoku indicator and we are entering and exiting based on the 15 min timeframe. You can watch the video below for the steps to create this strategy. To check backtest results of one of the stocks, you can visit: https://embed.streak.world/?id=c54c8a7d-3388-4505-8f6c-e88e83a9ea43&s=NSE_INDIANB&source=in
Finding Nifty Range
If you are a swing trader, it helps to find the range of the nifty for the coming days. There are many methods for this, here we will be using the historical volatility method. The plot below shows the distribution of the daily returns of nifty over one year. We can see that the values are normally distributed.

The X-axis is showing 1-day returns of nifty and the Y-Axis is showing the number of days on which that particular return was generated in the period of July 2020 – June 2021.
The standard deviation value is the historical volatility of the stock. Using 1 day mean and standard deviation, we have calculated the 2 days mean and standard deviation as follows:

As we can see in the graph, the returns are following a normal distribution. And whenever values are normally distributed, 68% of the values will lie within 1 standard deviation. Using this information, we can calculate the upper and lower range bounds for nifty for any time period with 68% confidence. Let’ s see an example :

Using Tuesday’s morning price and the upper and lower limit that we calculated earlier, we are now able to calculate the range of nifty closing by Wednesday evening with 68% confidence. To benefit from this information, we can create a short strangle strategy by selling Out of the Money Calls and Puts outside these limits. In the next section, we are going to see how we can create this strategy.
Strategy Example 2:

In this strategy, we are shorting call and put which are out of the money by 6 strike prices from the ATM. The short is being initiated on Tuesday morning and we are exiting it on Wednesday afternoon just before the market close. We have chosen 6 because the 68% confidence limit will lie within the +-6 strike ranges. If we go any further out of the money than this, the premiums collected will be very low, the volumes will be low and the bid-ask spread will be high. Choosing lesser out-of-the-money strikes than 6 will result in a range that has less than 68% confidence. You can refer to the video below for the strategy steps. To check backtest results of one of the legs, visit: https://embed.streak.world/?id=c54c8a7d-3388-4505-8f6c-e88e83a9ea43&s=NSE_INDIANB&source=in
Scanner Example 1:

With this scanner, we are going to identify the stocks which are trading slightly lower than the 52 week high.

This scanner will scan all the stocks that are trading a maximum of 2% below their 52 week high. If you want to increase the gap, you can decrease the number ‘0.98’. Making it 0.97 will scan all the stocks that are trading a maximum of 3% below their 52 week high.
Scanner Example 2:

Using this scanner, we are going to identify stocks that have been consolidating after a but up-move. The conditions are as follows:

Conclusion:
The holding period for swing traders is from a few days to weeks. Hence the frequency of trading is less than day trading. Swing traders can trade in stocks, futures, and also in options. They primarily use technical analysis, due to the short-term nature of the trades. Swing traders have to take care of the overnight risk. Strategies can be created and backtested to check the performance of our strategy ideas on the historical data. For doubts, you can write to us at [email protected] or let me know in the comments.
Disclaimer: The information provided is solely for educational purposes and does not constitute a recommendation to buy, sell, or otherwise deal in investments.


Hiii….
I had prepare a scanner in CHARTINK.COM but unable to execute on streak, whearas in Chartink.com i am getting proper signal during market hours.
Can you please help me to make that scanner on Streak so that can use it during live market hours.
Regards
Yes sure. Please send us your requirement at [email protected]
Hi! We can surely help with this. Kindly drop us a mail at [email protected] with the exact requirement