Super confused with the SuperTrend? This might be the only article you’ll need!
And if you’re a swing trader? This might be the only indicator you’ll need!
So open up your price charts, plot out the Supertrend on your favorite stock, and let’s get started.
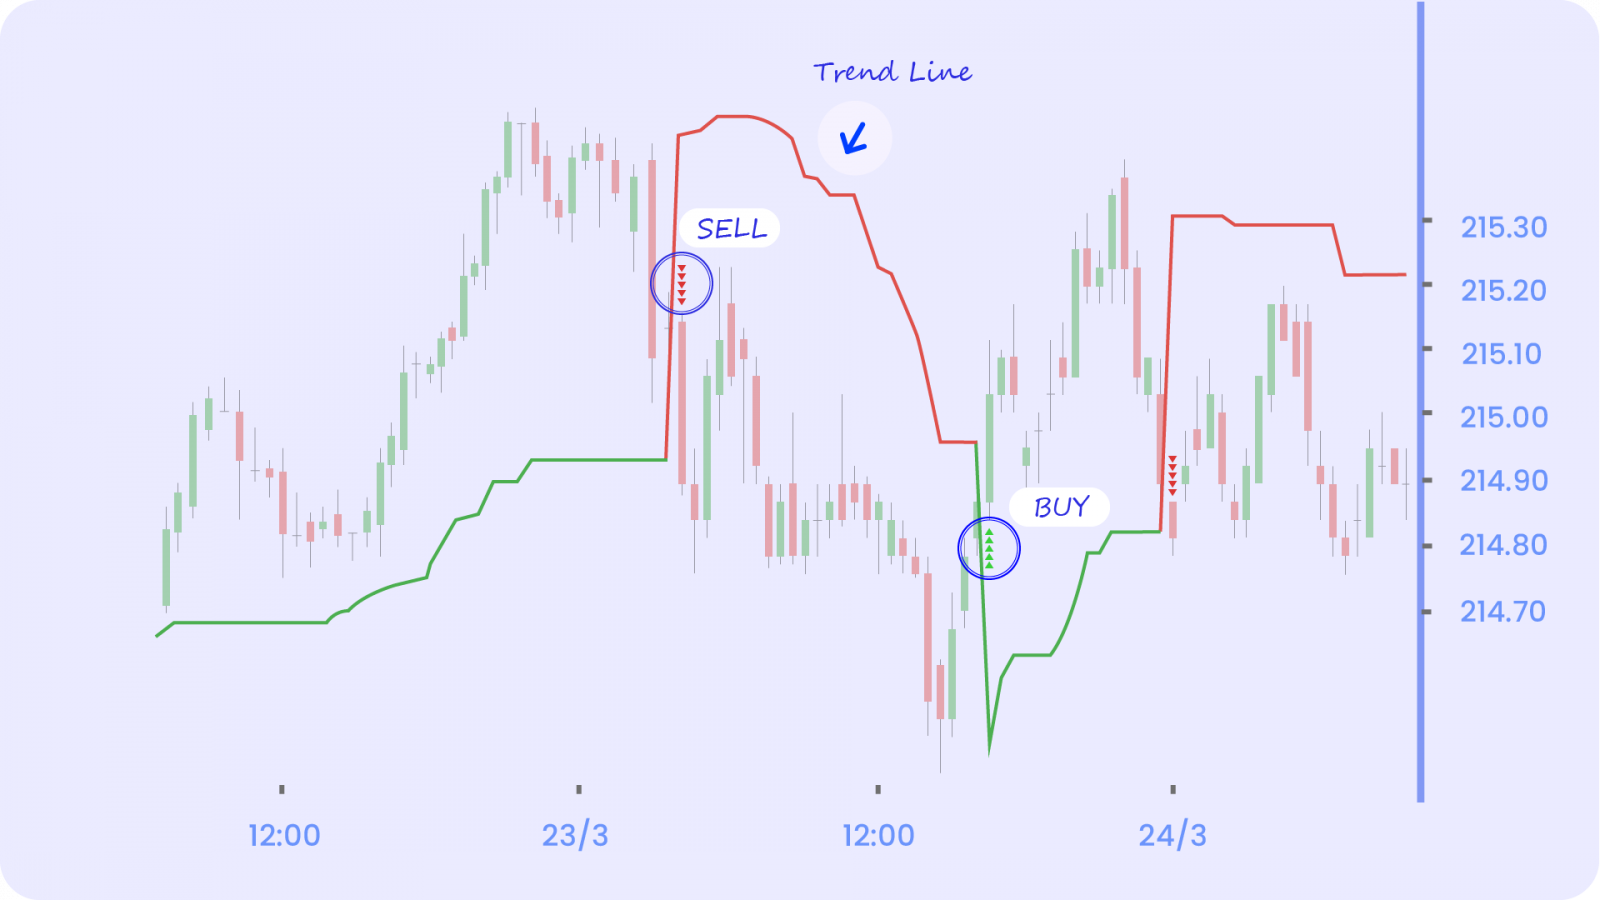
The SuperTrend alternates between green and red and is just one continuous line. It DOES NOT predict the direction of the trend. Instead, it will guide you by initiating a position & suggesting that you stay in the trend, once the direction is established. It works best in a trending market. The SuperTrend indicator generates fewer false signals compared to the Moving Average trading system. Hence, it is more preferred. But before you read any further, you should know about the Average True Range, since the SuperTrend is built on it.
Parameters of SuperTrend
The SuperTrend has important parameters!
- Period – This refers to the ATR number of days. The general setting on most price charts is 7. This means that the system will calculate the ATR value for the last 7 days.
- Multiplier – This refers to a value by which the ATR will get multiplied. The general setting is 3 on most price charts. Now, why is the multiplier so important? Rather, what role does it play? If the multiplier value is too high, then a lesser number of signals are generated. And if the multiplier value is too small, then the frequency of signals increases, hence the chances of generating false trading signals are quite high. Keeping it between 3 to 4 is usually the safest.
Trading with the SuperTrend
The supertrend has a unique ability to flip! Yes, it actually flips over the closing prices. And this indicates a signal.
- Buy Signal – This is generated when the stock price turns greater than the indicator value. The indicator color turns green, and you can also see a crossover of the price and the indicator (price greater than indicator value). You’ll see a green arrow over the candlestick or price point you can go for a long position on.
Once the long position has been taken by you, it is advised to hold the position till the price closes below the green line. Basically, the green line helps as a trailing stop-loss for the long position.
- Sell Signal – This is generated when the stock price turns lesser than the indicator value. The indicator color turns red, and you can also see a crossover of the price and the indicator (price lesser than indicator value). You’ll see a red arrow over the candlestick or price point you can go for a long position on.
The sell signal can be used to initiate a fresh short or exit long. Although waiting for the sell signal to exit the existing long position can sometimes lead to the loss. So you have to use your discretion here.
Once the short position has been taken by you, it is advised to hold the position till the price closes below the red line. Basically, the red line helps as a trailing stop-loss for the short position.
It is important to notice how the indicator changes colors and how often does it give a correct signal. It can generate a lot of false signals in a trending market. Hence, always use multiple indicators to confirm the validity of your trade.
Finally, this brings us to the trading strategy.
Trading Strategies With SuperTrend:
- Buy Strategy: If your strategy is to buy when the SuperTrend indicator indicates buy (green arrows as per charts) then use: Supertrend crosses below close
- Sell strategy: If your strategy is to sell when the SuperTrend indicator indicates sell (red arrows as per the charts) then use: Supertrend crosses above close
Happy Trading! 😄


