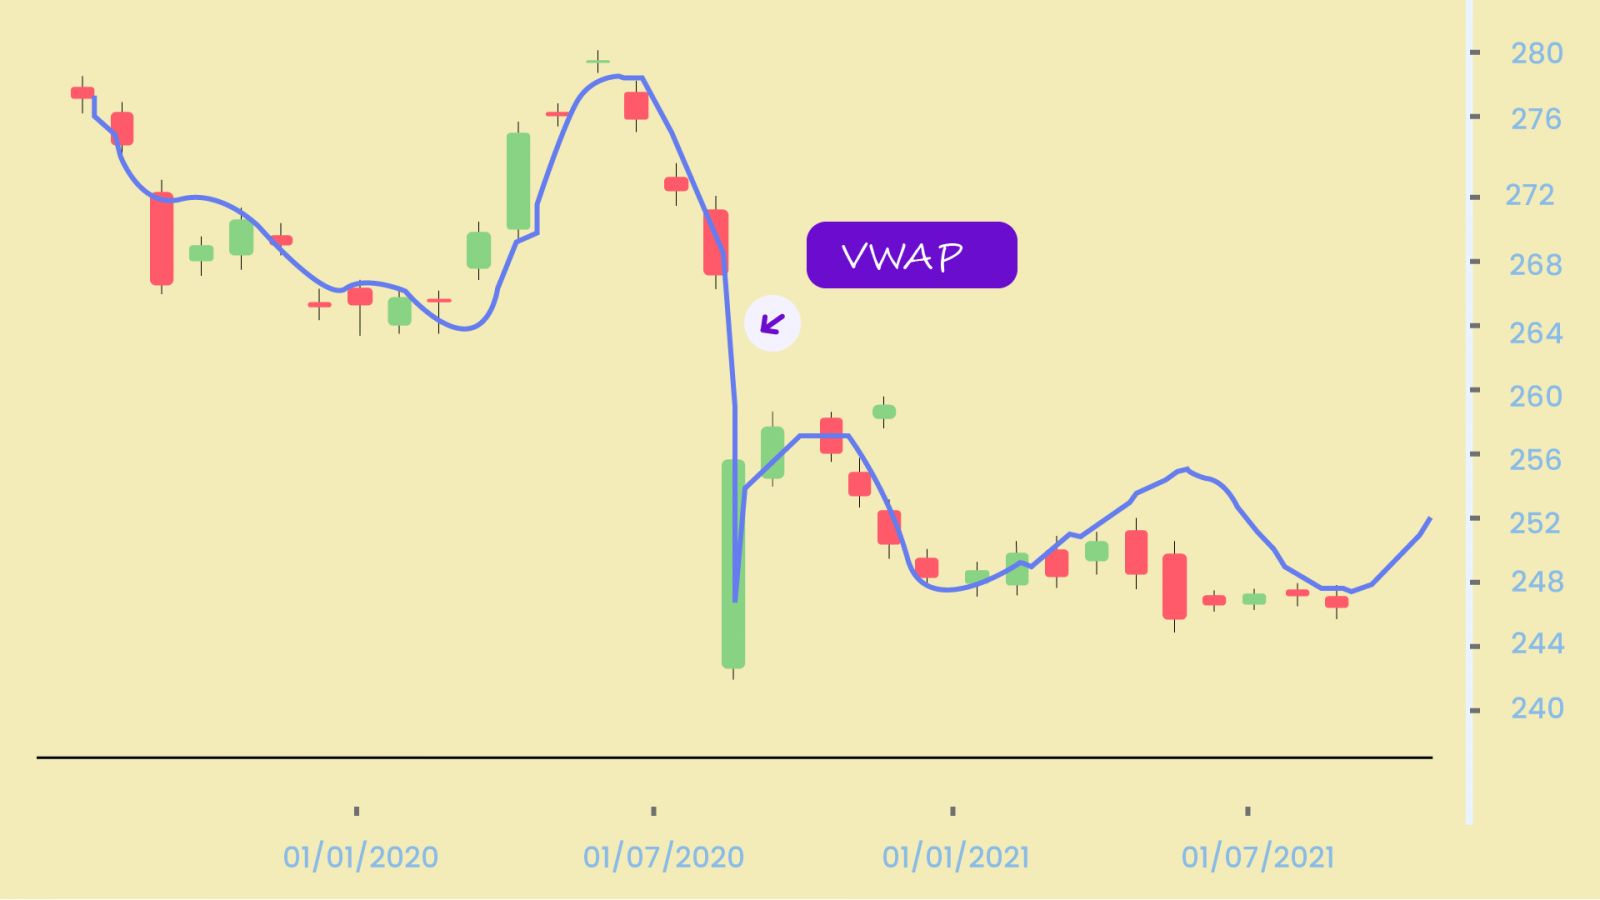
Are you in search of an indicator that shows the equilibrium level of stocks? Your search is over! The VWAP aka Volume Weighted Average Price provides you with the equilibrium level as well as acts as a support and resistance indicator. It gives the average price that a stock is trading at throughout the day. And as the name is screaming out loud, it is based on both volume and price.
And for the geek in you, here’s how it’s calculated:
- Calculate the Typical Price for the period: [(High + Low + Close)/3)]
- Multiply the Typical Price by the period Volume: (Typical Price x Volume)
- Create a Cumulative Total of Typical Price: Cumulative(Typical Price x Volume)
- Create a Cumulative Total of Volume: Cumulative(Volume)
- Divide the Cumulative Totals: Cumulative(Typical Price x Volume) / Cumulative(Volume)
Voila, you have your VWAP ready! So, what does the VWAP tell you and how to use it? For that, you need to first open up your price chart and apply the indicator to your favorite stock.
Using the VWAP
You’ll see that the VWAP is just one line plotted over the price chart. You can use this move into or out of stocks with as small of a market impact as possible. Institutions usually try to buy below the VWAP and sell above the VWAP. This way their actions push the price back toward the average, instead of away from it.
You may use the VWAP as a trend confirmation tool. You can build trading rules around it. For example, when the price is above VWAP, you may prefer to enter only long positions. When the price is below VWAP they may enter only short positions. This is also known as the VWAP Pullback. You may even let the market make a move for the first couple of candles and then wait for a pullback to the VWAP. After that, you either go long with the trend or short with the trend, whichever way the market is moving. This is a great area to enter a trade. You know if the price closes on the other side of where you got in, then it’s time to get out and move on to the next trade.
Limitations of Using VWAP
VWAP is a single-day indicator. It restarts at the open of each new trading day. Attempting to create an average VWAP over many days could mean that the average becomes distorted from the true VWAP reading as described above.
Now, while some institutions may prefer to buy when the price of a security is below the VWAP, or sell when it is above, VWAP is not the only factor to consider. In strong uptrends, the price may continue to move higher for many days without dropping below the VWAP at all or only occasionally. Therefore, waiting for the price to fall below VWAP could mean a missed opportunity if prices are rising quickly.
VWAP is based on historical values and does not inherently have predictive qualities or calculations. Because VWAP is anchored to the opening price range of the day, the indicator increases its lag as the day goes on. This can be seen in the way a 1-minute period VWAP calculation after 330 minutes (the length of a typical trading session) will often resemble a 390-minute moving average at the end of the trading day.
Happy Trading! 😄


