The On-Balance Volume (OBV) is a momentum indicator that helps predict changes in stock price with the help of volume. Well, where there is a great volume, there is something brewing. And Joseph Grainwville understood this well. He designed the OBV to project when major moves in markets would occur based on volume changes. The predictions by the OBV as described as ‘a spring being wound tightly.’ Grainville believed that when volume increases sharply without a significant change in the stock’s price, the price will eventually jump upward or fall downward. The OBV can digest the crowd sentiment well to predict bullish and bearish trends. Pitting the price action and the OBV together can generate better signals than the changing green and red signals at the bottom of the price chart.
Like Always, Here’s for the Geek in You
The OBV gives a running view of the stock’s trading volume. It indicates whether the volume is flowing in or out of a given stock. It is a cumulative total of the volume (positive and negative). The calculation involves 3 major steps:
- If today’s closing price is higher than yesterday’s closing price, then: Current OBV = Previous OBV + today’s volume
- If today’s closing price is lower than yesterday’s closing price, then: Current OBV = Previous OBV – today’s volume
- If today’s closing price equals yesterday’s closing price, then: Current OBV = Previous OBV
Why Should You Care About the OBV
The theory behind the OBV is based on the distinction between institutional investors and less sophisticated retail investors. As mutual funds and pension funds begin to buy into an issue that retail investors are selling, the volume may increase even as the price remains relatively level. Eventually, volume drives the price upward. At that point, larger investors begin to sell, and smaller investors begin buying.
Hence, it gets important to track these large institutional investors. What might happen is that institutional money might drive the price up. Looking at this other investors jump on the bandwagon and once the price tops out, the institutional investors sell the stock. In other words, they take the advantage of divergences between price and money as a synonym of the relationship between “smart money” and the disparate masses, hoping to showcase opportunities for buying against incorrect prevailing trends.
Interpretation of the OBV
OBV rises when volume on up days outpaces volume on down days. OBV falls when volume on down days is stronger. A rising OBV reflects positive volume pressure that can lead to higher prices. Conversely, falling OBV reflects negative volume pressure that can foreshadow lower prices. Granville noted in his research that OBV would often move before price. Expect prices to move higher if OBV is rising while prices are either flat or moving down. Expect prices to move lower if OBV is falling while prices are either flat or moving up.
Since the indicator is cumulative, the actual value is irrelevant. Instead, you should look at the nature of OBV movements over time; the slope of the OBV line carries all of the weight of analysis.
You can use the OBV for the folowing:
- First, define the trend for OBV. Second, determine if the current trend matches the trend for the underlying security. Third, look for potential support or resistance levels. Once broken, the trend for OBV will change and these breaks can be used to generate signals. Also, notice that OBV is based on closing prices. Therefore, closing prices should be considered when looking for divergences or support/resistance breaks. Finally, volume spikes can sometimes throw off the indicator by causing a sharp move that will require a settling period.
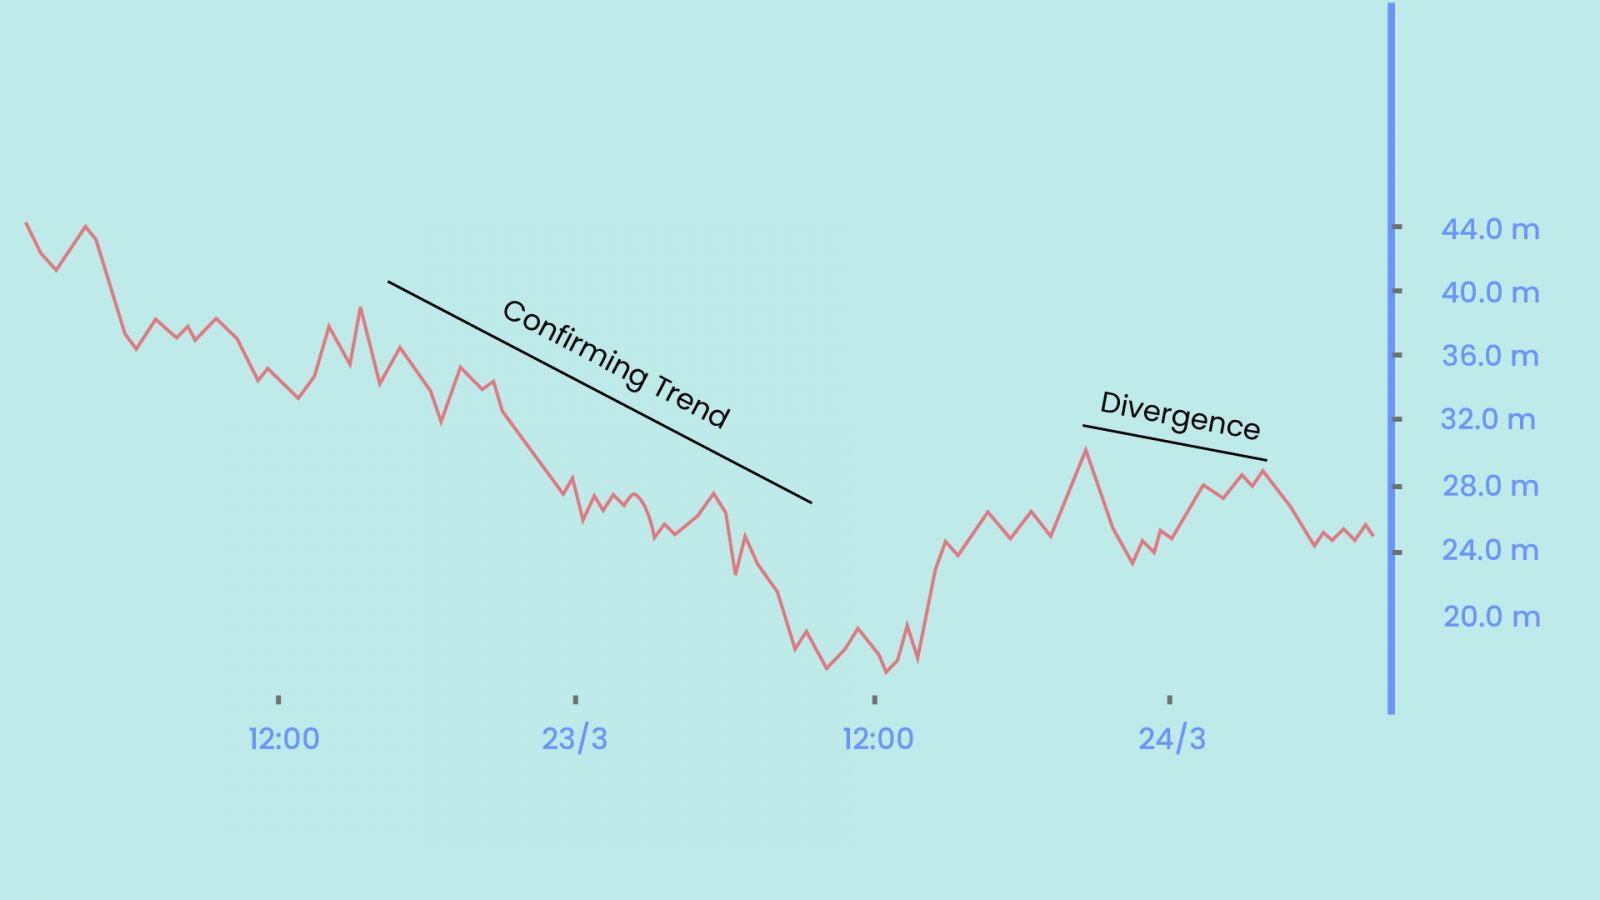
- Also, divergences are truly based on the theory that volume precedes prices. A bullish divergence forms when OBV moves higher or forms a higher low even as prices move lower or forge a lower low. A bearish divergence forms when OBV moves lower or forms a lower low even as prices move higher or forge a higher high. The divergence between OBV and price should alert chartists that a price reversal could be in the making.
- Sometimes OBV moves step-for-step with the underlying security. In this case, OBV is confirming the strength of the underlying trend, be it down or up. Hence, OBV can be used to confirm a price trend, upside breakout, or downside break. The trends in OBV usually match the trends in Prices. Hence it can also be used for trend reversals.
Difference Between OBV & A/D
OBV and the A/D line are similar in that they are both momentum indicators that use volume to predict the movement of “smart money”. However, this is where the similarities end. In the case of OBV, it is calculated by summing the volume on an ‘up day’ and subtracting the volume on a ‘down day.’ But the formula for the A/D, without getting too complicated, is that it uses the position of the current price relative to its recent trading range and multiplies it by that period’s volume.
Limitations Of OBV
This is a leading indicator. And just like lagging indicators have their limitations, so do leading indicators. First of all, it is prone to false signals. Therefore, you should balance out by pitting it together with a lagging indicator – maybe a moving average line. You can then look for OBV line breakouts; you can confirm a breakout in the price if the OBV indicator makes a concurrent breakout.
Another important thing to note is that a large spike in volume may throw the On-Balance indicator off-balance – that too for quite a while. For example, a surprise earnings announcement, being added or removed from an index, or massive institutional block trades can cause the indicator to spike or plummet, but the spike in volume may not be indicative of a trend.
Happy Trading! 😄


