Have you ever looked at a chart and noticed the Stochastic indicator is overbought. So, you immediately go short because you think the market is about to reverse. And here’s what happened next – the market stalls! Pause for a while…and then it blasts off higher! ANd you’re left wondering, what just happened?
Hence, here’s everything you need to know about the Stochastic Oscillator to prevent this from happening.
What is the Stochastic Indicator
“Stochastics measures the momentum of price. If you visualize a rocket going up in the air – before it can turn down, it must slow down. Momentum always changes direction before price.” – George Lane, founder of Stochastic
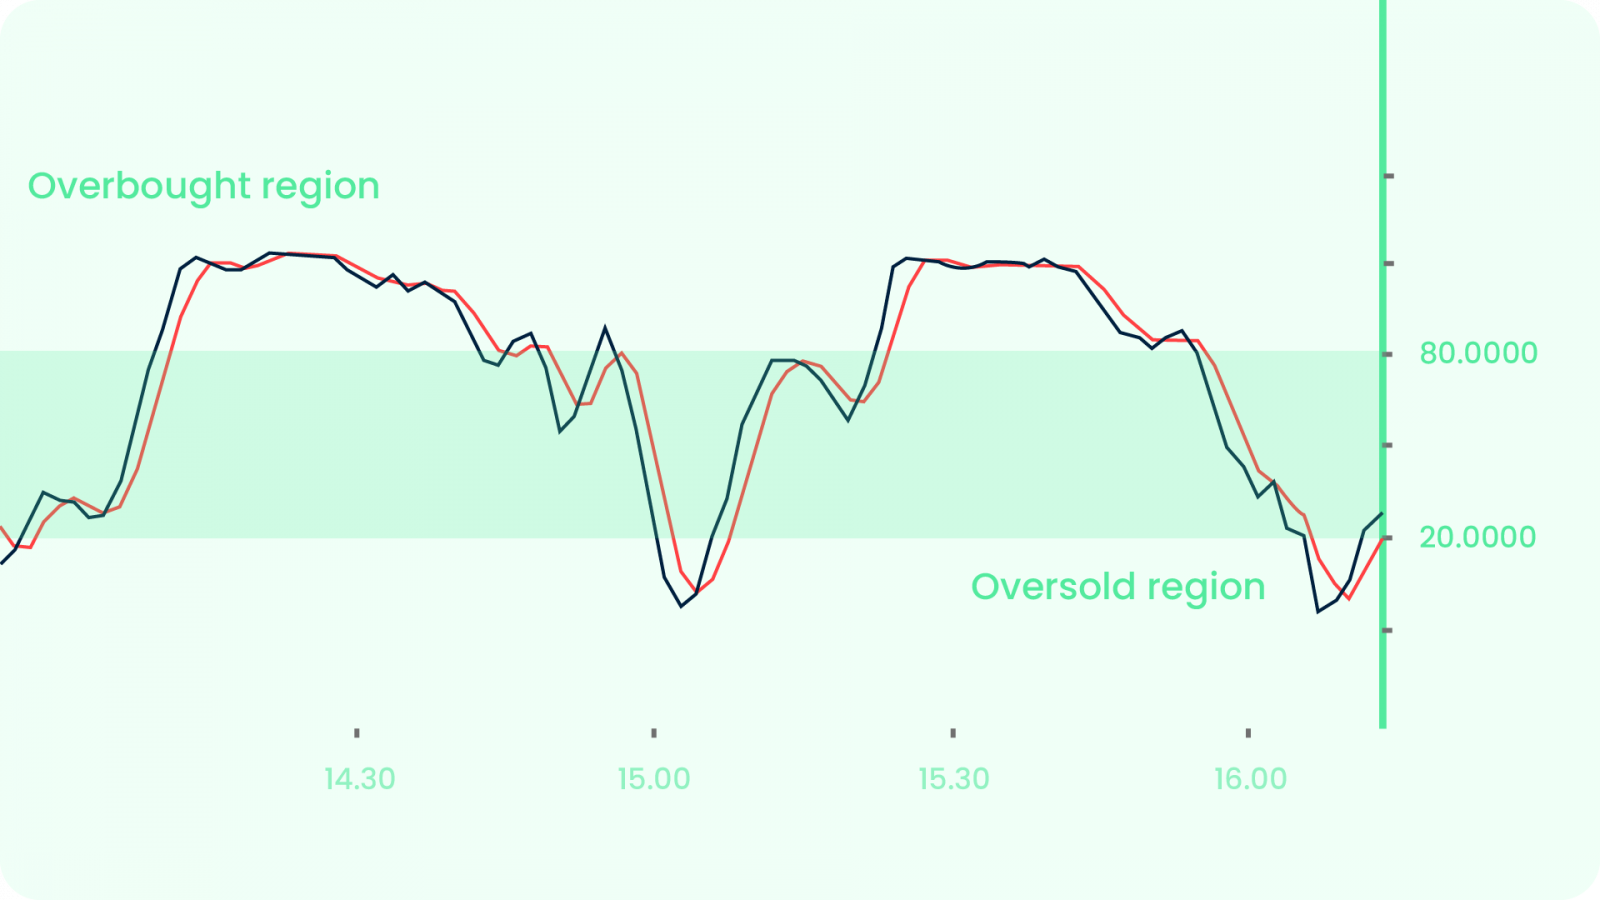
Now that we have the the words of the founder out of the way, let’s open up the price charts and apple the Stochastic Indicator. The general setting of this indicator has is (20,1,1). There is no specific time period to use. You can use your own own setting based on your trading style. But 20-period Stochastic represents the 20 trading days in a month. And a single line is enough to interpret what it means.
The line oscillates between 0 to 100. If it crosses above 80, then it represents a strong Bullish Mometum. And if it crosses below 20, it represents a strong Bearish Momentum.
Before talking about how the Stochastic is useful for traders, lets talk about the a few mistakes to avoid at first glance:
- You go long or short when the indicator represents oversold or overbought respectively – A quick recap, Stochastic is a momentum indicator. So, when it’s at an overbought level (above 80), it means the stock has strong bullish momentum. It doesn’t necessarily mean a trend reversal. The stock might still rally upwards. The Stochastic may stay in the overbought area for a long periods. As you can see in the example below: if you’d have gone short, it’d have been really sad. A stock can remain in the overbought section longer than you can imagine.
- Divergence means market reversals – Again, a quick recap, divergence occurs when the price makes a higher high but the indicator shows a lower high aka when 2 signals diverge from one another. According to textbooks, stock sjow reversals after divergences. But you need to pause here and think because it might not be the case. Here’s an example to show you how the market continued to rally down even after a divergence.
Both of the above mistakes can be easily avoided, if you Trade with the trend — and not against it. Moving on, how can you use the Stochastic for creating Trading Strategies.
“Predict” Market Turning Points
You might start of by setting up a 200-period Simple Moving Average on your price chart.
- If the price is above 200-period moving average (MA), then look for long setups when Stochastic is oversold
- If the price is below 200-period moving average (MA), then look for short setups when Stochastic is overbought
This method can help you identify where the pullback will end, so that you can time your trades better. Do not blindly sell, when the indicator represents overbought.
You can also use one more way as an entry or exit signal. When you see the Stochastic crossing above 20, it’s telling you bullish momentum is stepping in (and vice versa). So you could take your trades accordingly. But do not mistake this as a trading strategy because it’s not. Rather, it’s an entry trigger to get you into a trade. A BIG difference.
Limitations of Stochastic Indicator
Since this is a momentum indicator and helps you ride the trend, it pretty much useless in a ranging/sideways market. Instead of using stochastic, all you need to do here is buy the support and sell the resistance.
Stochastic Momentum Index
The Stochastic Momentum Index (SMI) is am important indicator to learn about. It is more refined version of the stochastic oscillator. It employs a wider range of values and has a higher sensitivity to closing prices. William Blau developed the SMI, which attempt to provide a more reliable indicator, less subject to false swings.
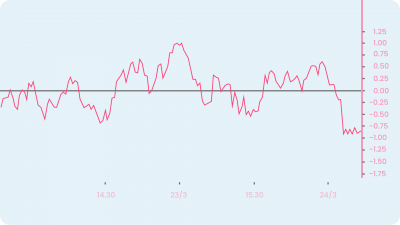
It calculates the distance of the current closing price as it relates to the median of the high/low range of price. The SMI has a normal range of values between +100 and -100. When the present closing price is higher than the median, or midpoint value of the high/low range, the resulting value is positive. When the current closing price is lower than that of the midpoint of the high/low range, the SMI has a negative value.
Like the stochastic oscillator, the SMI may be used to indicate overbought or oversold conditions in a market. It can be used with volume indicators to show if the momentum carries significant selling or buying pressure. You can also use the SMI as a general trend indicator. Values above 40 can represent a bullish trend & values less than -40 can represent a bearish trend.
The Difference Between The Relative Strength Index (RSI) and The Stochastic Oscillator
Both RSI and Stochastic are widely used momentum oscillators used for technical analysis. They can also be used in tandem and this creates an entire new indicator known as the Stochastic RSI. But then there are certain differences which might not meet the eye: the stochastic oscillator is predicated on the assumption that closing prices should close near the same direction as the current trend. But the RSI tracks overbought and oversold levels by measuring the velocity of price movements.
Stochastic RSI
Okay so when you apply the Stochastic Oscilltor formula to the RSI instead of the prices, you get an entirely new indicator called the StochRSI. And the result is a line that fluctuates between 0 to 1 with a 0.5 as the centre line (which practically looks the same as the 0 to 100 chart). This indicator was developed to take advantage of both momentum indicators in order to create a more sensitive indicator. It takes into consideration the stock’s historical performance instead of a generalized analysis of the price change.
For the geeks, here’s the formula! StochRSI=(Current RSI-Lowest RSI)/(Highest RSI-Lowest RSI)
A StochRSI reading above 0.8 is considered overbought, while a reading below 0.2 is considered oversold. Just like the standard RSI, the most common time setting used for the StochRSI is 14 periods. The 14 periods involved in the StochRSI calculation are based on the chart time frame. So, while a daily chart would consider the past 14 days (candlesticks), an hourly chart would generate the StochRSI based on the last 14 hours.
Interpretation of the StochRSI
Again, there are 2 major ways in which you can use the StochRSI:
- As over bought and oversold signals – When the value drops below 0.2, it means the RSI value is at the lower end and the short-term direction of the underlying security may be nearing a low a possible move higher. Conversely, a reading above 0.80 suggests the RSI may be reaching extreme highs and could be used to signal a pullback in the price of the stock.
- Identify short-term trends – If you look at it in the context of an oscillator with a centerline at 0.50. When the StochRSI is above 0.50, the security may be seen as trending higher and vice versa when it’s below 0.50.
Because of its greater speed and sensitivity to market movements, the Stochastic RSI can be a really indicator for both short-term and long-term analysis. But as you know, more signals means more traps. So you should always use an indicator alongside another complementary indicators.
Happy Trading! 😄


