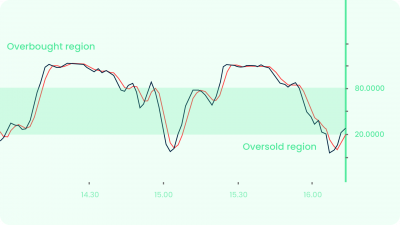
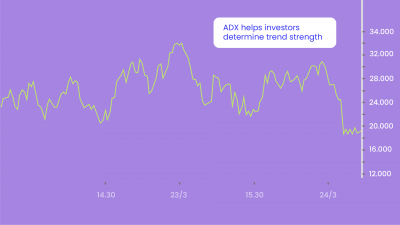
A momentum indicator just like the Stochastic Oscillator – the Williams %R aka the Williams was developed by Larry Williams. It moves between 0 to -100 and tells you about overbought and oversold levels. A reading above -20 is overbought and a reading below -80 is oversold. You can find entry and exit points in the market using the Williams %R. It compares a stock’s closing price to the high-low range over a specific period, typically 14 days or periods.
Here’s the Math for the Geeks
It is really not important to remember an equation by heart. However, it is important to understand its underlying components. The Williams %R is calculated based on price, typically over the last 10 or 14 periods.
Williams %R Formula = (Highest High n – Close current period) ÷ (Highest High n – Lowest Low n) x -100
- Record the high and low for each period over 14 periods.
- On the 14th period, note the current price, the highest price, and the lowest price. It is now possible to fill in all the formula variables for Williams %R.
- On the 15th period, note the current price, highest price, and lowest price, but only for the last 14 periods (not the last 15). Compute the new Williams %R value.
- As each period ends compute the new Williams %R, only using the last 14 periods of data.
Note: The n in the formula is the number of periods or candlesticks in the equation.
As you can see above, the indicator is all about the high, close, and low prices. Another way of thinking about the indicator at a high level is that its primary focus is to identify the volatility and momentum of a stock.
What Does Williams %R Tell You?
Okay, we have the basic stuff out of the way. Let’s talk about how to use the WIll%R.
- First of all, the indicator tells you where the current price is relative to the highest high over the last 14 periods or whatever lookback period you’ve chosen. If it’s between -20 and 0, then the stock is overbought or near the high of its recent price range. If it is between -80 to -100, the stock is oversold or far from the high of its recent price range.
- Second, when the price crosses -80 and starts moving above, it could signal an uptrend. On the other hand, if the price crosses -20 and starts moving below, it could signal a possible downtrend.
- Third, you could watch out for momentum failures. For example, during a strong uptrend, the price will reach above -20 now and then. But then if it crosses below -20, and is unable to get back above -20 during the second rise, the uptrend might be in trouble. You should be ready for a possible decline in price. The same applies during a downtrend.
Trading Strategies with the Will%R
- Cross of -50: Instead of using the indicator for simply identifying overbought and oversold market conditions, you can develop a trading plan around the -50 line cross. After becoming overbought and oversold, if the indicator crosses the -50 line, it generally indicates a shift in momentum. At this point, you can start to look for opportunities to trade the direction of the cross. Once crossing below -50, you then wait for the bar to close to place a sell order.
Before continuing, let’s talk about the Will%R Divergences. Divergences are basically points where the price action and indicator conflict. Williams %R divergences can be really powerful and should be paid attention to.
- Ride the Williams – You must have read the saying, rise the trend. Or you must’ve heard of the strategy where you ride Bollinger Bands! Well, you can do the same thing with the Williams %R. Here is the setup and you will love its simplicity. First look for the indicator to break -20 to the upside, so the shading kicks in. Then wait to see if the indicator can stay below -30 for 10 periods in a row. If the stock can show this level of strength you can then use the first dip as a buying opportunity to jump on the primary trend. The hardest part of this strategy is not pulling the trigger too soon.
The Difference Between Williams %R and the Fast Stochastic Oscillator
The Williams %R represents a market’s closing level versus the highest high for the lookback period. On the other hand, the Stochastic Oscillator, which moves between 0 and 100, illustrates a market’s close in relation to the lowest low. The Williams %R corrects for this by multiplying by -100. The Williams %R and the Stochastic Oscillator end up being almost the same indicators. The only difference between the two is how the indicators are scaled.
Happy Trading! 😄


