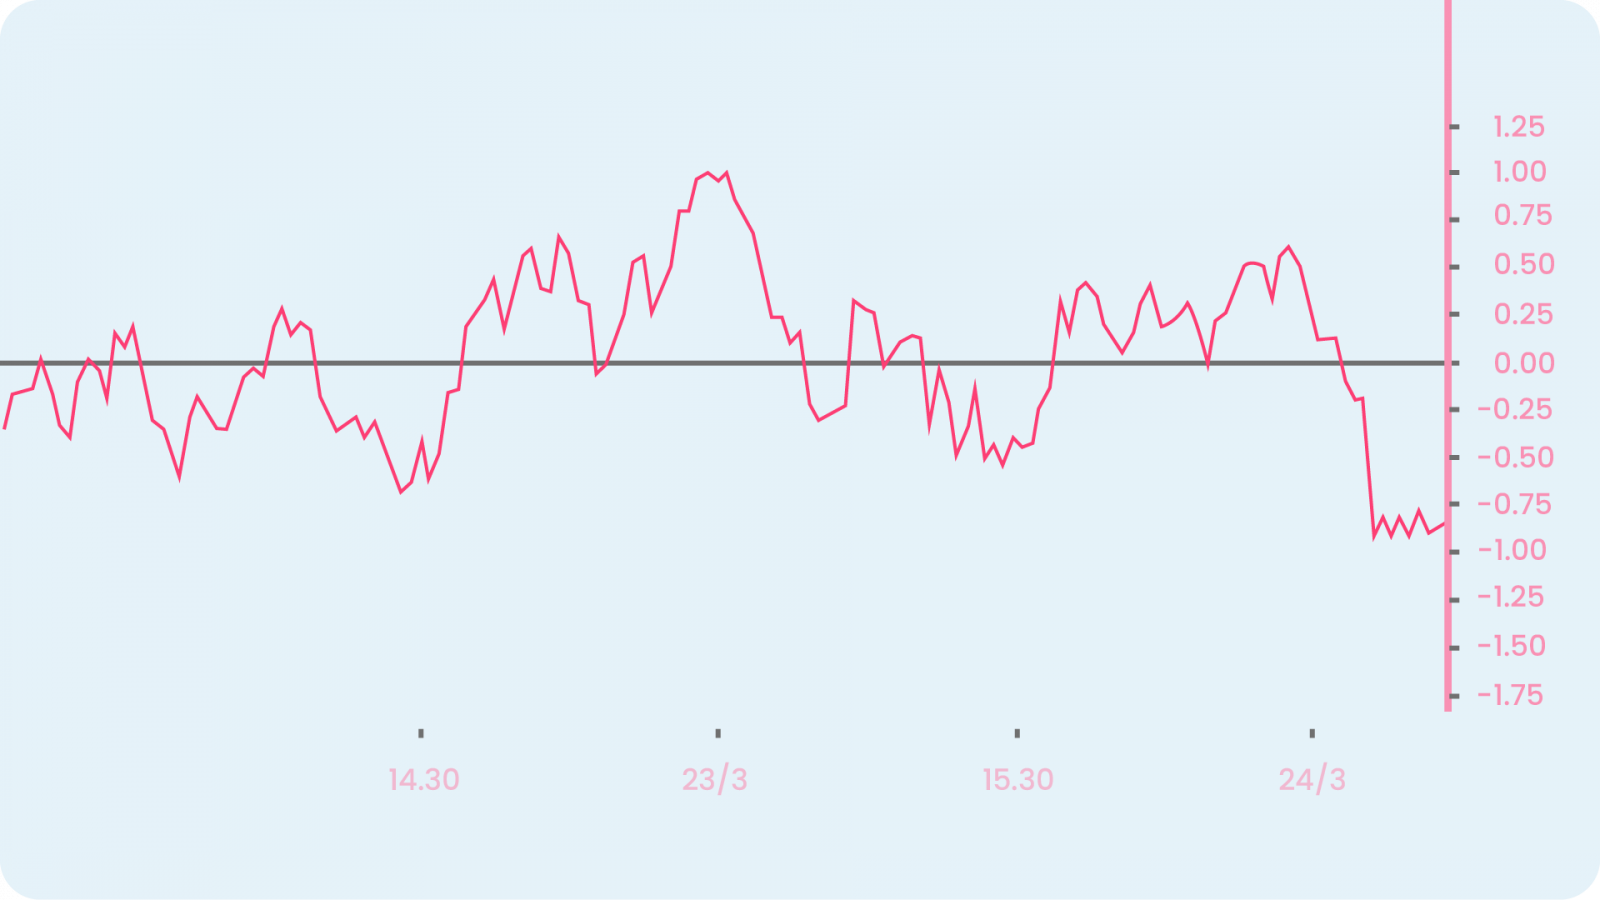
As the gives away the entire purpose of the indicator, the Price Rate of Change (PROC) measures the percentage change in price between the current price and the price a certain number of periods ago. It is an unbounded momentum indicator and is plotted against a zero-level midpoint.
For the Math Geeks
The main step to calculate the ROC is picking the “n” value. This indicates how many periods ago the current price is being compared to. For short-term analysis, you can choose n to be 9 and for long-term analysis, many traders also chose n to be 200.
Now follow the steps below:
Step 1: Note the most recent period’s closing price.
Step 2: Note the period’s close price from ‘n’ periods ago.
Step 3: Plug the prices from steps two and three into the ROC formula
The formula: [(Current Price / Price ‘n’ periods ago) – 1] x 100
Step 4: As each period ends, calculate the new ROC value.
Example: For example, if a stock’s price at the close of trading today is INR 10, and the closing price 5 trading days prior was INR 7, then the 5-day PROC is 42.85
Smaller ‘n’ values react quickly to price changes and lead to a lot of false signals. But this doesn’t mean that you shouldn’t use them. Even if you use larger values, you can ‘miss’ a lot of signals because they react slowly to price movements. Therefore you should test it out yourself and use the values you are most comfortable with.
Interpreting the PROC Oscillator
If the price changes are to the upside, the indicator moves above the zero line into positive territory indicating an uptrend. And if the change is to the downside, the indicator moves into negative territory or below the zero line indicating a downtrend. Finally, when the price is consolidating, the PROC indicator will tend to move towards zero. These centreline crossovers are one of the major use cases of PROC.
The PROC is also prone to whipsaws, especially around the zero line. Therefore, yous should use this signal simply for alerts that a trend change may be underway.
We can also determine overbought and oversold levels using PROC. You can refer to the past data and check what PROC values resulted in price reversals. You might end up finding quite a few points. When the PROC reaches these extreme readings again, you can use it as a possible signal of reversal
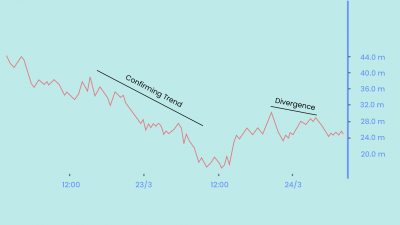
ROC is also commonly used as a divergence indicator that signals a possible upcoming trend change. Divergence occurs when the price of a stock or another asset moves in one direction while its ROC moves in the opposite direction. For example, if a stock’s price is rising over a period of time while the ROC is progressively moving lower, then the ROC is indicating bearish divergence from price, which signals a possible trend change to the downside. The same concept applies if the price is moving down and ROC is moving higher. This could signal a price move to the upside. Divergence is a notoriously poor timing signal since a divergence can last a long time and won’t always result in a price reversal.
The Difference Between the PROC Oscillator and the Momentum Indicator
The two indicators are very similar to each other except for the basic calculations. The PROC ‘divides the difference between the current price and the price n periods ago.’ This makes it a percentage.
The MOM indicator simply ‘multiplies the difference in price by 100, or the current price is divided by the price n periods ago and then multiplied by 100.’
In the end, they both tell us the same story and in a very similar fashion, too. It depends on you if you slightly prefer one over the other.
Limitations of PROC
We all know that the most recent price movement is always more important than the historical movements and data. The problem with PROC is its formula where it gives equal weight to the most recent price as well as the price from ‘n’ periods ago.
The indicator can be used for divergences but sometimes these signals occur far too early. When the PROC starts to diverge, the price can still run in the trending direction for some time. Therefore, divergence should not be acted on as a trade signal but could be used to help confirm a trade if other reversal signals are present from other indicators and analysis methods.


