Close your eyes…no wait…read the sentence first – close your eyes and imagine that you know exactly ‘on the very first tick’ that the price is going to breakout! Wouldn’t that be amazing? Well, of course. Well, what if there’s an indicator that somehow tells you about the move that counts.
Let’s talk about the Choppiness Index Indicator.
The indicator is basically an oscillator. And just like any other oscillator, it is bound by ranges. The range is 0 to 100. And the indicator uses a standard look-back period of 14 days. It also takes into account the Average True Range, another indicator used to measure volatility. Yes, Choppiness Index is also a volatility indicator. It measures the trendiness of the market only and NOT the future price direction.
Trading signals
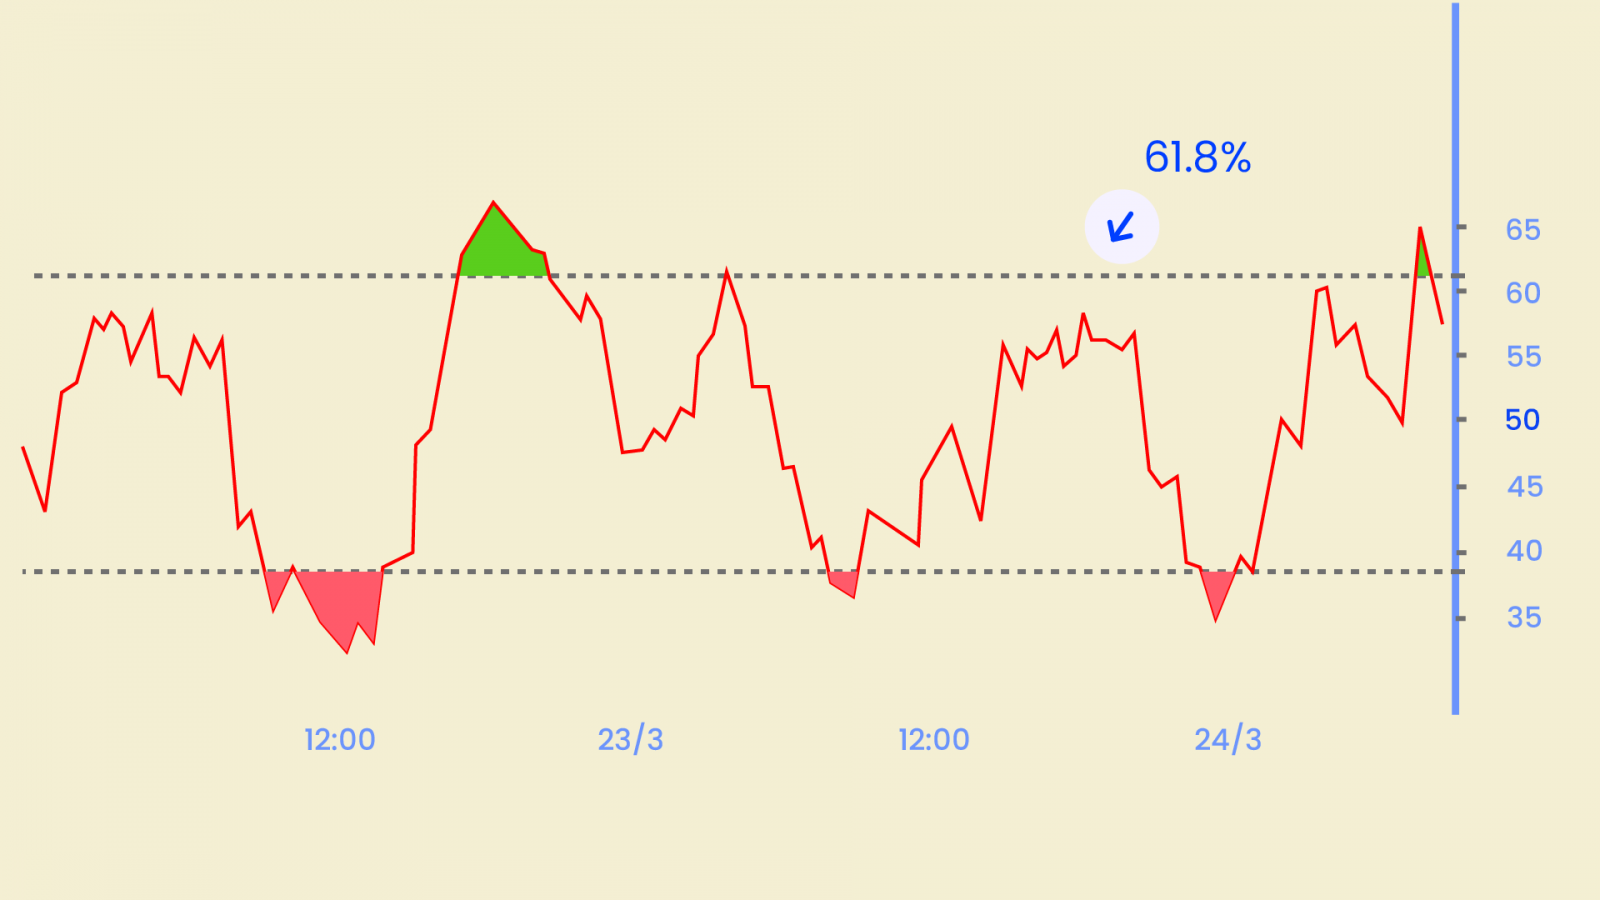
You can use the Fibonacci values as extremes for a choppy and trending market:
1. A high value above 61.8 (higher threshold) indicates consolidation.
2. A low value below 38.2 (lower threshold) signals a trend.
The Choppiness Indicator is often lagging. But as long as it stays above mid 50 lines, the trend continues to be choppy. On the other hand, if it stays below the midline, it remains trending.
The strength in the indicator is best displayed when used as a confirmation that a stock is starting to trend or breaking out. A simple, yet effective way to validate signs from the choppiness index indicator is to see if volume accompanies the move. Where there is volume, there is likely something brewing. So, couple up your Choppiness Index with a Volume Indicator and test it out.


