Introduction:
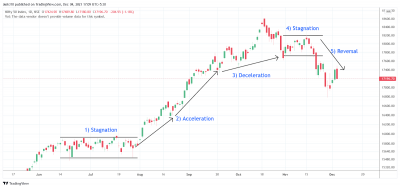
Chart patterns are recognizable repetitive formations on the price chart which have some predictive value. Traders have a certain behavior which is repetitive. All these behaviors of market participants combined together cause patterns to form on the price charts. Candlestick patterns appear over a very small number of candles (1-3) whereas chart patterns consist of a very large number of candles. Chart patterns are very popular as they are easy to recognize, help in determining the trend and are easy to implement.
Types of Chart Patterns:
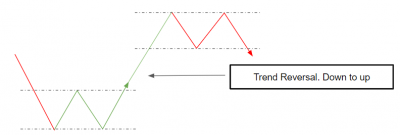
There are mainly two types of patterns; Continuation and Reversal. The prior trend is expected to reverse after the formation of a Continuation pattern and the prior trend is expected to continue in the same direction after formation of the continuation pattern.
| Continuation | Reversal |
| Prior trend direction continues after a breakout | Prior Trend reverses after a breakout |
| Breakout is in the direction of the prior trend | Breakout is in the opposite direction of the prior trend. |
| Eg. Flag, Pennant, Triangles (Depending on the direction of the breakout. | Eg. Double Top, Head & Shoulders, Triple Top |
Scanning for Patterns on Streak:
1) Triangles:
Triangles represent a zone of contracting volatility and indecision wherein neither the buyers nor the sellers are able to push the prices in any particular direction. Depending on where they are forming on the chart, they can be classified as continuation or reversal patterns. Two converging trendlines form a triangle pattern. There are mainly three types of triangles. They are as follows :
Creating a triangle pattern on Streak :
2) Double Tops & Double Bottoms
Double Tops and Double Bottoms are reversal patterns usually occurring over a larger time interval. They are categorized as reversal patterns and can never form a continuation pattern. They resemble ‘M’ & ‘W’ shapes on the chart. Double top should be preceded by a bullish trend and double bottom should be preceded by a bearish trend since they are strictly reversal patterns.
Creating a double top pattern on Streak :
3) Rectangles
Rectangles are sideways consolidation zones wherein the price moves within a horizontal zone. Rectangles can be either continuation or reversal pattern depending on their position of formation. Most often they appear as bullish reversal or continuation patterns.
Creating a Rectangle pattern on Streak :
Backtesting Chart Patterns on Streak:
We have created the below conditions for a double bottom strategy. The 1st two conditions are for creating the double bottom pattern. The 3rd condition is to check if a candle is crossing above the resistance line of the double bottom pattern. The exit is based on stop loss and target.


Conclusion:
As a result actions of the market participants, there are various different types of patterns which occur daily in the market . A good scanner can make it easy to discover these opportunities. You should always use stop-loss while trading patterns because even the most perfect looking patterns can fail. The performance is reduced for the patterns which are very common amongst traders. Due to this, some traders also trade pattern failures. Pattern failure is caused when the breakout of the pattern is invalidated. As many traders are trapped in the breakout trade, they rush to cover their positions creating a big price movement in the opposite direction of breakout.
Disclaimer: The information provided is solely for educational purposes and does not constitute a recommendation to buy, sell, or otherwise deal in investments.


Can I get the ideas from the beginning of the stock market in the technical analysis
Hi! Kindly elaborate your query