Now we all know that intraday takes up a lot of our time. But if you don’t have enough time to devote, then swing trading is for you. You can even pull it off with your full-time job. It doesn’t require you to sit in front of your computer all day. It also gives you enough opportunities to trade and book profits in the market.
So, let’s begin!
The Basics
As the name implies, swing trading tends to capture short-term ‘swings’ in the market. After you enter the trade, your motto is to exit the trade before the opposing swing or opposing pressure comes in.
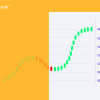
Here’s an example:
(Insert a chart gif shoeing swings)
Here’s another example:
The Advantages and Disadvantages
The very first advantage is already mentioned earlier. You don’t need to spend hours in front of your monitor and you can easily manage it along with your full-time job. Also, it is so much less stressful compared to Intraday. Swing traders usually trade on higher frames. And that is another addition to the advantages as higher time-frames reduce the complexities involved in the trading.
The major disadvantage is that you run the risk of overnight loss. Also, you won’t be able to ride trends the way you during Intraday.
So, now we have the basics out of the way, let’s talk about the Swing Trading methods.
What’s the Difference Between Swing Trading vs. Day Trading?
| Swing Trading | Day Trading | |
| Frequency | Multiple trades per week | Multiple trades per day |
| Number of Transactions | Fewer | More |
| Time Horizons | Positions have long time horizons | Positions have short time horizons |
| Time Required | Less active time required | More active time required |
| How You Trade | Can use your brokerage account | Need up-to-date trading software |
Methods
Suppose you want to buy a Television. You might either buy it online or from a local store. Now you do some research and find out that the current price is INR 50K. You give it a thought and realize that Diwali is right around the corner and price are sure to drop. You’d rather wait a few days and buy for less.
The same rules apply to swing trading. Buy when the price swings low. And sell when the price swings higher. But how do you identify these points? Here are a few methods you maight come handy.
- Support and Resistance
In the world of trading, it is very important to know about support and resistance. Support helps you identify the potential buying pressure. Prices struggle to break below the support line as it tries to push the price back up. On the other hand resistance helps you identify the potential selling pressure. Prices usually struggle to breakout above the resistance as the line tries tries to push the price down.
An example:
While using the method, you may buy at the support and sell at the resistance. But this is not all. You need to use a few more methods to confirm your position.
- Moving Average
The price of a stock either moves along the or usually pullbacks towards the Moving Average line. Higher the value of MA, the smoother the line. Hence, during a strong trending market, the pullbacks will usually occur towards the 20SMA. And in a weak trending or a ranging market, the pullbacks will usually occur towards the 100SMA
An example:
- Trend Lines
Just like support and resistance, trend lines are another importamt concept. The slope of an upward trend line on the chart shows an upward buying pressure while the slope of a downward trend line shows a selling pressure.
Example of an up upward trend line:
When do you Enter a Trade
You can enter a trade the moment the price reaches an area of value or, let it show signs of reversal before putting on a trade. Now there’s no right or wrong, both approaches can work.
But personally, I’d prefer to let the market show signs of reversal first. Here’s how.
- The False Break
This entry technique takes advantage of breakout traders who are “trapped”.
Here’s how it works…
Breakout traders tend to go long on the break of the highs.
But what happens when the market breaks out higher, only to reverse towards the downside?
Well, now the breakout traders are “trapped” as their long positions are in the red.
And if the market continues to lower, it will trigger their stop loss which fuels further price decline.
And this is how The False Break can serve as an entry trigger into a trade.
Here’s an example: A False Break at the highs
Next…
Bullish reversal candlestick patterns — Hammer
Bullish reversal candlestick patterns signify that buyers are momentarily in control.
Now, there are different bullish reversals candlestick patterns like Hammer, Bullish Engulfing, Morning Star, and etc.
- Hammer
A Hammer is a (1- candle) bullish reversal pattern that forms after a decline in price.
Here’s how to recognize it:
- Little to no upper shadow
- The price closes at the top ¼ of the range
- The lower shadow is about 2 or 3 times the length of the body
And this is what a Hammer means…
- When the market opens, the sellers took control and pushed prices lower
- At the selling climax, huge buying pressure stepped in and pushed the price higher
- The buying pressure is so strong that it closed above the opening price
In short, a hammer is a bullish reversal candlestick pattern that shows rejection of lower prices.
Bearish reversal candlestick patterns — Shooting Star
Bearish reversal candlestick patterns signify that sellers are momentarily in control.
Now, there are different bearish reversals candlestick patterns like Shooting Star, Bearish Engulfing, Evening Star, and etc
- Shooting Star
A Shooting Star is a (1- candle) bearish reversal pattern that forms after an advance in price.
Here’s how to recognize it:
- Little to no lower shadow
- The price closes at the bottom ¼ of the range
- The upper shadow is about 2 or 3 times the length of the body
And this is what a Shooting Star means…
- When the market opens, the buyers took control and pushed prices higher
- At the buying climax, huge selling pressure stepped in and pushed the price lower
- The selling pressure is so strong that it closed below the opening price
In short, a Shooting Star is a bearish reversal candlestick pattern that shows rejection of higher prices.
Now, if you want to learn more about the different candlestick patterns, then go check out The Monster Guide to Candlestick Patterns.
Stop-Loss
One of the biggest mistakes you can make is to have a TIGHT stop loss.
You’re probably thinking…
“But a tight stop loss reduces my risk and improves my risk to reward.”
Not true.
Because more often than not, you’ll get stopped first before the market can move in your favor.
This means your analysis might be correct but you still end up losing money because your stop loss is too TIGHT.
It’s ridiculous.
So, what’s the solution?
Increase the size of your stop loss so you can withstand the “noise” of the markets and watch the market move in your favor.
Here’s how…
Your stop loss must be at a location where if reached, will invalidate your trading setup.
This means if you short a head & shoulders pattern, then your stop loss should be at a level where if the market hits it, the entire pattern is “destroyed”.
Or if you’re long Support, then your stop loss should be below Support such that if the market hits it, chances are, Support is broken.
Now, I don’t suggest placing your stops just below Support or Resistance because you’ll get stop hunted easily.
Instead, give it some “buffer” so your trade has more room to breathe.
If you want to decide how much “buffer” to give, you can use the Average True Range (ATR) indicator and set your stop loss 1ATR below Support.
Here’s what I mean:
Now if you want a more detailed explanation of this concept, then go watch this training video below…
Swing trading: Where to take profits before the market does a 180-degree reversal against you
Now, let’s piece the puzzles together and so you can develop a swing trading strategy that works.
Here’s how to do it:
- Identify a range market (market condition)
- Wait for the price to reach Support (area of value)
- If the price reaches Support, then wait for a False Break (entry trigger)
- Set your stop loss 1 ATR below the candle low and take profits before Resistance (stop loss and target profit)
An example:
And here’s another (but in a downtrend):
Now…
This isn’t the only way to swing trade the markets.
Because by using the principles I’ve shared, you can also use different areas of value like (trend line, trend channel, moving average, and etc.).
Swing Trading Strategies
- Stuck in a box
Where the price is pretty much stuck in a range. Similar to what you’ve seen earlier:
The core idea here is that the market is in a range.
You want to buy low and sell high, so how you would go about doing it is to let the price come into an area of support and let the price reject the lower prices.
This, as you can see, is rejecting lower prices over here:
The market, at one point in time, was trading lower and lower and lower.
And then suddenly the buyers step in and push price all the way up higher.
Finally closing near the highs:
So, this is a swing trading setup for you to actually go long.
When you see a price rejection of the lows of support…
You can look to get long on the next candle and look to set your stop loss at a distance away from the lows:
Because you don’t want to set it at the precise low as it’s very common for the price just take out the previous lows.
So, what I would suggest is that give it some distance, some buffer.
Now…
Your goal as a swing trader is to capture one swing.
The question is…
Where is the opposing pressure likely to come in?
If you ask me, chances are it would come in the resistance area.
If you look left, there is a resistance area.
You want to take your profit somewhere about here:
As you can see in this example, clearly the market didn’t reach far enough before it reversed back into the area of support.
And then finally, at the second attempt, it hit resistance:
Depending on how you manage your trade, this could be a break-even trade, a small winner, or even a loser.
I’m not going too much detail into trade management, because that will be a video for another time.
But I just want to share with you the core concepts of swing trading.
The other one is what I call…
- Catch the wave
This is used when the market is in an uptrend.
When the market is trending, you are trying to time your entry and capture just one swing in an uptrend.
One thing to point out is that in an uptrend, there are multiple swings.
As a swing trader, if you ask me, your best chance of riding a swing is to capture the swings that are in-line with the trend:
You can see that the moves that are in line with the trend are usually stronger.
Usually, you want to trade with the move that is in line with the trend.
I call this the trending move!
How we can go about doing it is using the 50-period moving average:
In an uptrend, if it’s in a healthy uptrend…
The market tends to bounce off the 50 EMA which is shown as a blue line.
What you can do is to wait for the price to come to an area of value, which is this 50-period moving average.
Again, look for a form of a price which actually can be a hammer.
It can be what you call a bullish engulfing pattern, and etc.
In this case, you’ve got somewhat of a bullish engulfing pattern:
Notice the price came in.
At one point in time, it was near the 50-period moving average.
And then the buyer stepped in and finally pushed the price higher, closing near the highs.
As a swing trader, you can look to get long.
Again, for stop loss, give some buffer below the lows, and entry over here:
Then you can look to exit your trade just before the swing high:
Again, we mentioned exiting your trade before the opposing pressure kicks in.
This is the second strategy, catch the wave.
The final strategy that I want to share with you is I would say more aggressive.
But it still offers a favorable risk to reward on your trade if you execute it correctly.
- Fade the move
This is actually a counter-trend trade.
Because when the market is trending, and it has traveled quite a distance towards the swing high towards resistance…
There is actually an opportunity for you to take a counter-trend trade.
But I’ll share with you a little bit on how to manage this type of trade.
Because if you are not careful, the price can actually reverse quickly against you.
In this case, you can see that this market is in an uptrend and price came and retests back towards the swing high over here:
Notice it traveled quite a bit from the swing low all the way up into this swing high, and then the next candle…
It got rejected with a bearish engulfing pattern as it collapses lower.
But prior to this, as the market was breaking out higher, there are traders who went long on the break of these highs!
Because they are thinking…
“Hey, the market is breaking. All right, man, I better go long. The trend is up. I want to long the breakout. I want to catch the next move up higher. I don’t want to miss the trade.”
And then what happened?
Well, the next candle did a 180-degree reversal towards the downside.
That’s why you have the bearish engulfing pattern in the example.
And now the group of traders who went long earlier on the breakout are now trapped!
Frequently asked questions
Q1. Which moving average do you apply to the charts?
A1. On my TradingView, I have the 20, 50, and 200 MAs on standby. But I’ll only turn them on if they make sense. For example:
- If the price is in a strong trend, then I’ll display the 20 MA
- If the price is in a healthy trend, then I’ll display the 50 MA
- If the price doesn’t respect any MA, then I won’t have any MAs on my chart
Q2: Which is the best timeframe to use for swing trading?
A2. There is no best timeframe. The best timeframe is probably the one with which you can commit to and trade consistently with. For me, I like to take swing trades anywhere between the 4-hour and daily timeframe.
Q3: Which of these is the best to use for my entries and exits – support resistance, moving average or trendline?
A3. There’s no best one over here. It depends on the market condition:
- If the market is in a weak trend or in a range, then support resistance will be useful
- If the market is in a strong trend, then you might want to use the 20 MA
- If the market is in a healthy trend, then you could use the 50 MA
- If the market is respecting a trendline, then you could use that trendline
So it all depends on the market condition at the moment.


