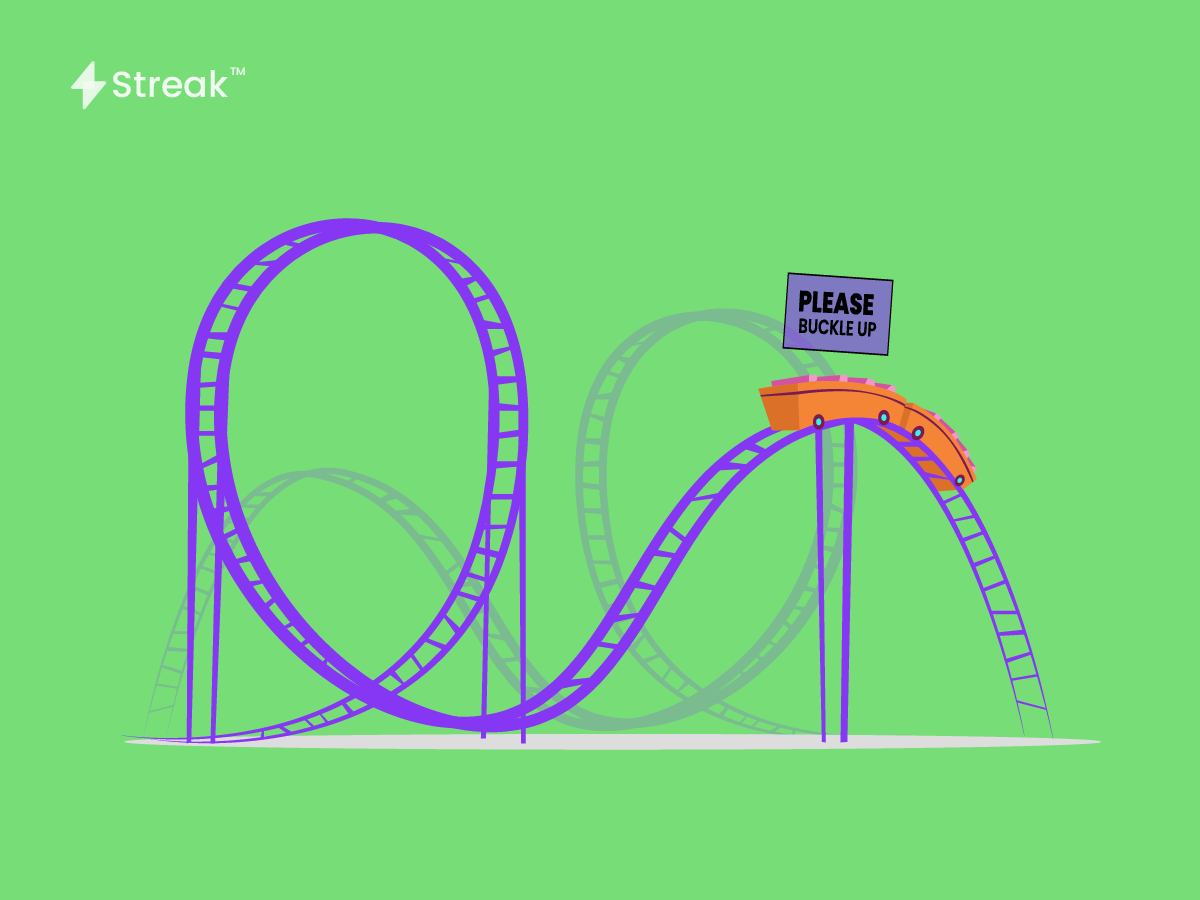
In simple terms, volatility is the frequency or degree with which the price of a stock (or the stock market as a whole) fluctuates up and down. More specifically, you can always use certain tools and indicators to calculate the volatility. All you need to look at is how much an asset’s price varies from its average price. This can be done with the help of standard deviation.
Now one example of what makes the markets volatile is when there are external events giving rise to uncertainty. Usually, stocks prices move by approximately 1% during the course of the day. But at the beginning of the COVID 19 pandemic, stock prices rose and fell by 5%. No one knew what was going to happen. The uncertainties involved with the lockdown and virus led to frantic buying and selling.
Another example is Budget. Whenever India announces its budget in February, a lot of stocks are affected due to the decisions taken by our Financial Minister. A greater pump into a particular sector would attract investors while reducing the budget for a sector would drive them away. Similarly, for companies reporting their annual and quarterly budgets. Winning confidence is the key to attract more investors.
Volatility is often associated with the Fear Factor. This gives rise to bearish markets and other downward trends. Markets might even go deep in red. The important thing to be noted is that volatility is not a measure of direction. It only means how big are the swings in the market. It is a measure of current uncertainty.
That being said, not all securities have equal volatility. For example, stocks as a whole have the potential to yield better returns than bonds. But stocks are also more volatile. Bonds produce moderate returns but come with less volatility and risk. Now, this does not necessarily mean that all stocks are more volatile than bonds. High-yield junk bonds come with much more volatility.
You can easily have a glimpse of the stock’s performance along with all the important parameters and technical indicators in the ‘technicals’ section of Streak.
Note: Just because the Volatility of a stock is high doesn’t mean that the stock is not worth investing in. On the flip side, a stock with less volatility won’t mean a smart addition either. You can not really escape volatility. And the key is to use the volatility to your advantage.
Volatility can also make you frantic and take the wrong decisions. It is important that you have your risk management in place and know about the trading biases and disciplines that make or break traders.
Why is volatility important?
By understanding volatility, you can put yourself in a better position. You can understand the current stock market conditions as a whole and then move forward with analyzing the risk involved with a particular stock. Volatility will help you create a portfolio that takes your risk appetite as well as your long/short-term objectives into account.
Now you must be thinking – are risk and volatility the same thing? Yes and no. If you want to buy low and sell high in intraday, then the meaning of volatility and risk are deeply tangled. It also matters the most to traders who want to sell their stocks soon. But volatility is just noise for long-term traders who want to hold stocks for many years. The daily movements hardly matter to them. But long-term investing still involves risk. But the risks are not mostly based on fundamental analysis like the growth of a company.
Historical Volatility vs Implied Volatility
All traders rely on past data in some way or the other. Historical Volatility (HV) helps a great deal in identifying the points of extreme fluctuations in price. You can look back in history to the point where the stock price was volatile and check what events lead to the volatility. You’d then have an idea about when to enter and exit a trade. You’ll be better prepared. You can also perfectly time the markets and your trades.
Implied volatility (IV) describes how much volatility that options traders think the stock will have in the future. You can tell what the implied volatility of a stock is by looking at how much the futures options prices vary. If the options prices start to rise, that means implied volatility is increasing, all other things being equal.
That said, volatility is an important factor to consider while trading. The most common indicators that help gauge the volatility of the market are VIX, ATR, Bollinger Bands, Vortex, and Choppiness Index.
Happy Trading!


