As a trader, you need to capitalize on one very important factor. Any guesses? You need to trade at a price that is either too high or too low from where it should be. But there’s always some trouble to determine when?
Enter: The Aroon Indicator – to the rescue! It is a technical analysis indicator used to identify short-term trend changes in price. It can also help you trade the strength and the retracements. Its very functionality lies in the fact that it measures the time between highs and lows over a period of time – strong uptrends will regularly see new highs while strong downtrends will regularly see new lows. The indicator signals when this is happening, and when it isn’t.
It was developed by Tushar Chande in 1995 and the the word Aroon was derived from the sanskrit word whoch translates to “dawn’s early light.”
Before moving on with the basic interpretation of the indicator, let’s look at the 2 important components of the Aroon Indicator:
- Aroon Up: This is the line that measures the strength of the uptrend and the number of periods since a High
- Aroon Down: This is the line that measures the strength of the downtrend and the number of periods since a Low
Interpretation of the Aroon
For the geeks, who want to deep dive into the formula – here’s how to calculate the Aroon Indicator!
First, the indicator applied to 25 periods of data. Hence, it shows how many periods it has been since a 25-period high or low. Track the highs and lows for the last 25 periods on an asset. Note the number of periods since the last high and low. Plug these numbers into the Up and Down Aroon formulas. (add formula)
Therefore, an Aroon Up reading above 50 means the price made a new high within the last 12.5 periods. A reading near 100 means a high was seen very recently. The same concepts apply to the Down Aroon. When it is above 50, a low was witnessed within the 12.5 periods. A Down reading near 100 means a low was seen very recently.
Let’s talk about the important stuff now. When you plot the Aroon Indicator on your chart, it will appear as an Oscillator below your price chart. It moves between 0 to 100.
- An Aroon Up reading above 50 means the price made a new high within the last 12,5 periods. A reading near 100 means a high was seen recently.
- An Aroon Down reading above 50 means the price made a new low within the last 12,5 periods. A reading near 100 means a low was seen recently.
- When both Aroons are below 50 it can signal that the price is consolidating. New highs or lows are NOT being created. You can wait and watch for breakouts or the next Aroon crossover to signal which direction price is going.
A few more pointers to keep in mind while interpreting the Aroon are:
- When the Aroon Up is above the Aroon Down, it indicates A Bullish price movement
- When the Aroon Down is above the Aroon Up, it indicates a Bearish price movement
- Crossovers of the two lines tell us that trend is about to change. If the Aroon Up crosses above the Aroon Down, means an uptrend might be on the way. Similarly, if the Aroon Down crosses above the Aroon Up, means a downtrend might be on the way.
- The indicator moves between zero and 100. A reading above 50 means that a high/low (whichever line is above 50) was seen within the last 12 periods.
- A reading below 50 means that the high/low was seen within the 13 periods.
The Single Line Aroon
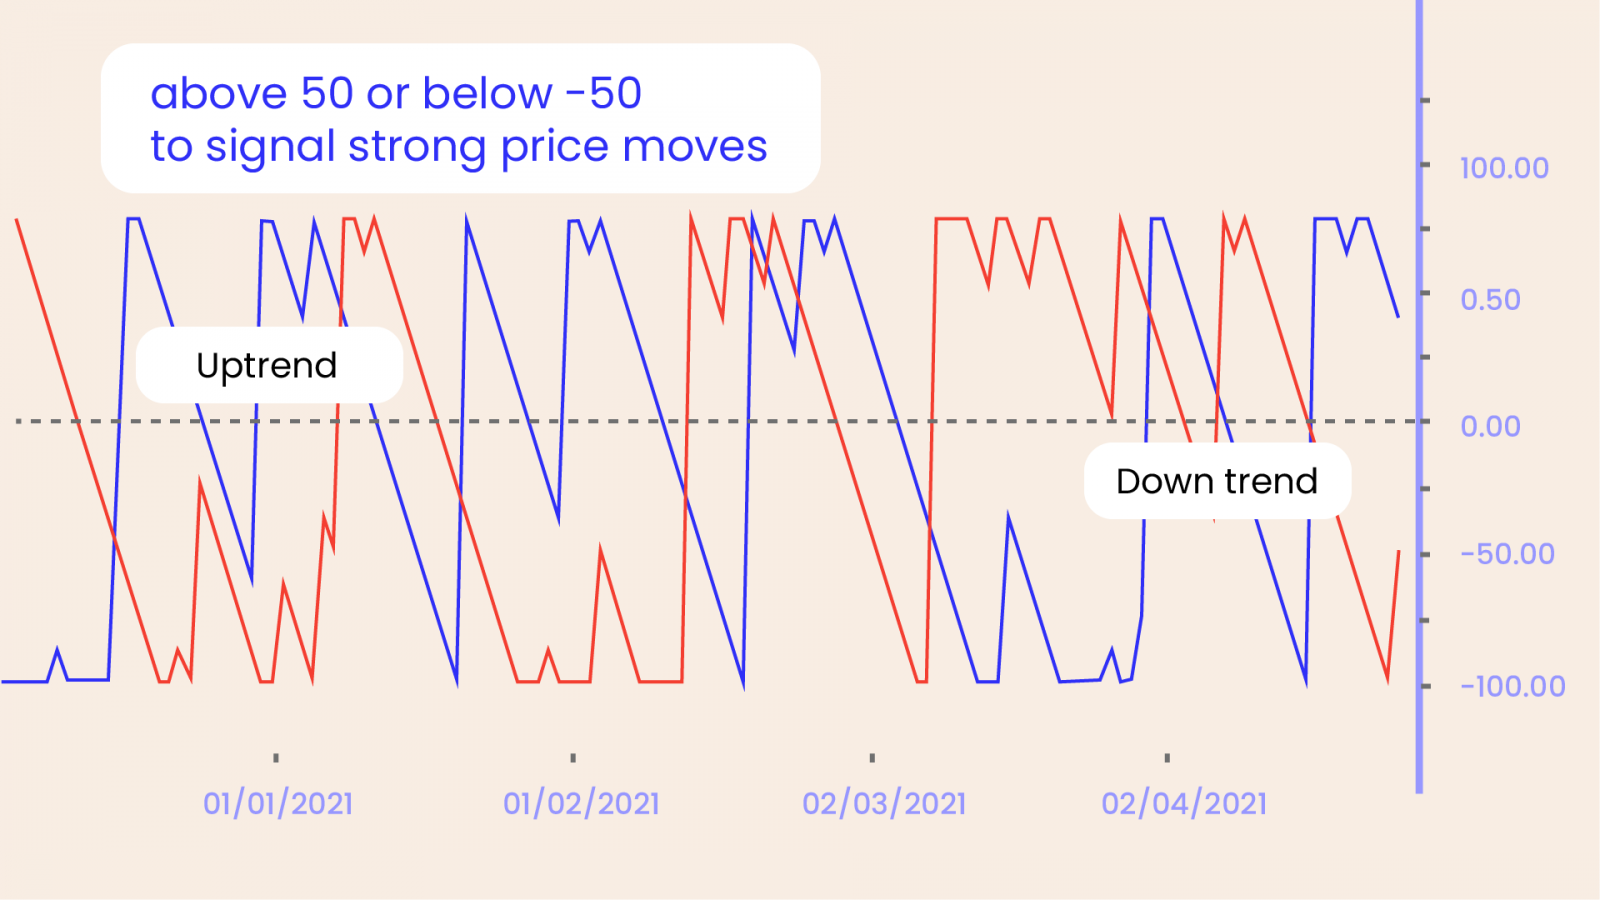
There’s ONE MORE version of the Aroon that a few price charts offer, It is known as a the Single-Line Aroon Oscillator. It ranges from -100 to +100. If the oscillator is somewhere around the middle Zero-Line, it signals the absence of a trend. The market is moving sideways and consolidating thr price. When the are above +50 or below -50, it represents a bullish or bearish trend respectively.
The Difference Between the Aroon Indicator and the Directional Movement Index (DMI)
The Aroon indicator is similar to the Directional Movement Index (DMI) developed by Welles Wilder. It too uses up and down lines to show the direction of a trend. The main difference is that the Aroon indicator formulas are primarily focused on the amount of time between highs and lows. The DMI measures the price difference between current highs/lows and prior highs/lows. Therefore, the main factor in the DMI is price, and not time.
The Difference Between the Aroon Oscillator and the Rate of Change (ROC) Indicator
The Aroon Oscillator is tracking whether a 25-period high or low occurred more recently. The Rate of Change (ROC) indicator also tracks momentum, but rather than looking at highs and lows, it looks at the how far the current price has moved relative to a price in the past.
Bottom Line – A Confirming or Filtering Indicator
The Aroon can signal perfect entry and exit points. But this is only for a few handful times. It also provides a lot of false signals. It is lagging and may occur too late, after a good rally or drop of the price.
A crossover might seem to be a good entry/exit point. But keep in mind that this doesn’t mean a big move is coming your way. The indictor simply measures the number of periods since a high or low has occurred. It doesn’t consider the size of the moves.
Hence, you should always usee another indicators in tandem with the Aroon. You can use it best for confirmation of trends and possible upcoming reversals. You can best use it to filter out trades in volatile or ranging markets.
Happy Trading! 😄


