Volume plays an important role in technical analysis since it helps in understanding the demand and supply of an asset. In this article, we…
Latest posts
Understanding the Choppiness Index Indicator
Traders often wonder how to avoid sideways markets. In this article, we will discuss a Technical indicator that can help you do just that…
Understanding the Elder Ray Index Indicator
Elder Ray Index is a momentum indicator that provides insights into both bullish and bearish forces at play in the market. In this article,…
Understanding Range and True Range
Range and True Range are the building blocks of understanding price volatility in financial markets. Range gives a basic overview of price movement, while…
Demystifying Average True Range (ATR)
In this current volatile market environment, understanding price movements and volatility is essential for all market participants. One of the key technical indicators that…
Time Series Forecast (TSF): All you need to Know
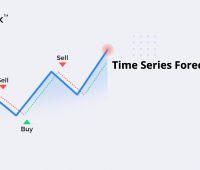
The Time Series Forecast (TSF) is a technical indicator that uses linear regression to plot a line that best fits historical price data. The…
Symbol Function in Streak
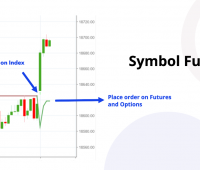
Traders often want to place an order on one instrument on the basis of a condition being checked on another instrument. To cater to…
Inside Bars: All you need to Know
In this blog, we’ll delve into the concept of Inside Bars, explore their characteristics, and discuss strategies to leverage their power in your trades.…
Understanding Limit and Market Orders and How to use them in Streak
Investing and trading can be a daunting task for beginners, especially when it comes to understanding the various types of orders and how they…
Multi Timeframe Analysis with Streak
Using multiple time frames can help you gain a deeper understanding of the market dynamics and the overall trend. When the higher time frames…


