Introduction: Chart patterns are recognizable repetitive formations on the price chart which have some predictive value. Traders have a certain behavior which is repetitive.…
Latest posts - Page 9
Price Action
“Trade what you see, not what you think”. As a trader, you need to drill one thing in mind – Price Action is King! …
Vortex Indicator
The Vortex Indicator was first proposed by J.W. Wilder in 2010. The beauty of the indicator lies in the fact that it can spot…
WillR Indicator
A momentum indicator just like the Stochastic Oscillator – the Williams %R aka the Williams was developed by Larry Williams. It moves between 0…
Volume-by-Price (VPT)
Volume-by-Price is an indicator that shows the amount of volume for a particular price range, which is based on closing prices. Volume-by-Price bars are…
The Moving Average
We all know that “The trend is your friend (until the end when it bends)”. Moving Averages are great indicators to gauge trend direction.…
The World of Indicators
Do you dabble in stock markets every single day? Now of course you’d need some tool to analyze the price movements of the security.…
Order flow of a strategy deployed using Streak
In my previous article, I discussed how to backtest a strategy using the expired contract data. This is a step-by-step guide for all new…
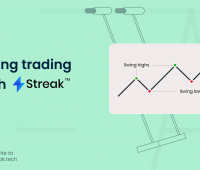
Swing Trading with Nifty Options and Stocks
Introduction: Swing Trading is a widely practiced discipline in the trading community. Swing trading involves taking trades that last a couple of days up…
Backtesting Short Strangle on Nifty Expired Contracts
Backtesting is a very important part of the trading strategy creation cycle and one must spend an adequate amount of time testing their strategy…


