The Awesome Oscillator was invented by Bill Williams. So Bill, what were you thinking before while giving this indicator a name?
Now the question is – does the name say it all? No! Although there are some widely used Awesome Oscillator trading strategies, you need to see how well does this indicator fit with your trading style. The indicator measures momentum by comparing recent market movements to past market movements and gauges whether bullish or bearish forces are currently driving the market.
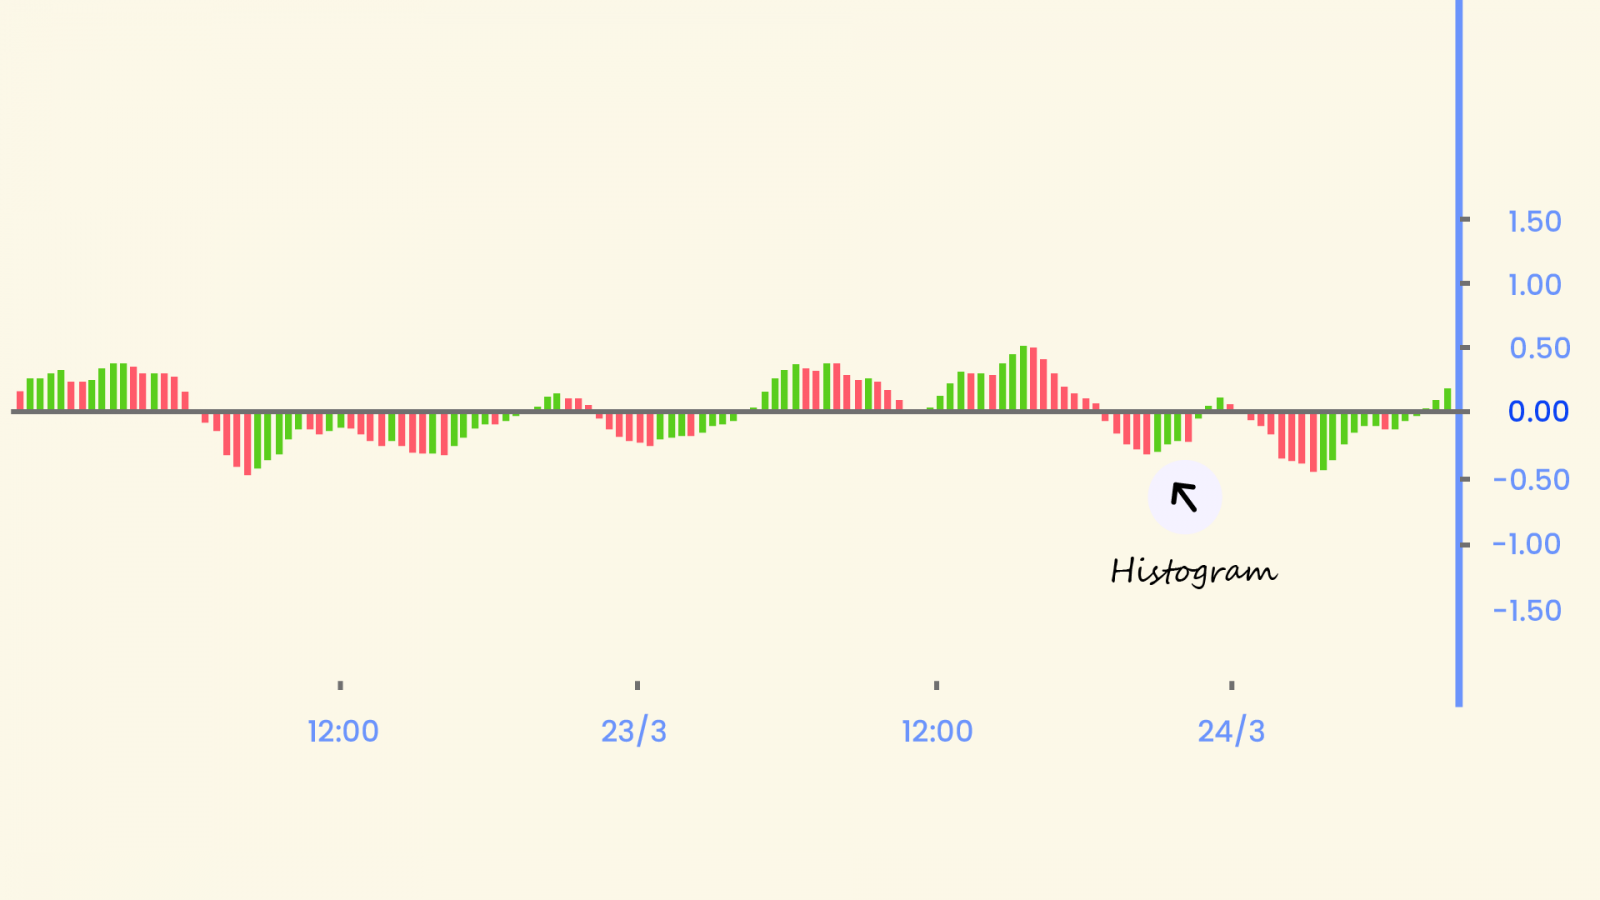
Fine, now pull up your price charts and plot the Awesome Oscillator. You’ll see that it appears as a histogram below the price chart. The histogram has a zero line in the center. It displays the market momentum of a recent number of periods compared to the momentum of a ‘larger’ previous number of periods.
The price movements are plotted on either side of the zero line. Green bars indicate that momentum is higher than the previous, showing upward momentum, while red bars indicate that it’s lower than the previous, showing downward momentum.
The Formula
It always gets easier to work with an indicator once you know the exact calculation behind it. Generally, the AO uses the 34-period and 5-period Simple Moving Averages.
The 34-period SMA of medina prices is subtracted from a 5-period SMA of median prices. You can use any time period – minutes, hours, or days – although many traders use a daily SMA as part of their awesome oscillator trading strategy to assess the prevailing trend of a market.
Awesome Oscillator Formula = 5-period SMA (median price, 5 periods) – 34-period SMA (median price, 34 periods), where Median Price = (high price of a time period + low price of a time period)/2
Zero-Line Crossover
The simplest way to interpret the AO is to observe when the bars go through (above or below) the zero line. If the indicator crosses above the zero line, then it is said to have a bullish momentum and if it crosses below the zero line, it is said to have a bearish momentum.
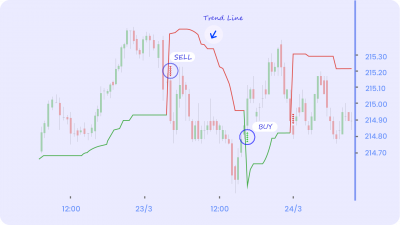
Buy Strategy: When the bar chart crosses above the zero line, it implies that the price of the stock is reversing course. You can assume that that the price either broke out above recent highs or simply reversed after reaching the bottom. This is a bullish signal and we might take a buy action for the particular stock. You can also look for a consecutive streak of three or more green bars before opening a long position.
Sell Strategy: When the bar chart crosses below the zero line, it implies that the price of the stock is reversing course either after hitting the highest point or is breaking out below recent lows. This is a bullish signal and we might take a sell action for the particular stock. You can also look for a consecutive streak of three or more red bars before opening a short position.
Divergence
Determining divergences is another useful feature of the AO. Divergence is simply when the price of a security is moving in one direction and an oscillating indicator is moving in the opposite direction. So, if you see a stock going up and making new higher highs and the AO making new lower highs, you have a divergence.
In intraday, bearish divergences signal that pieces are likely to correct and you should exit long positions while bullish divergences signal that you should exit short positions. It has to be noted that just because you see a divergence doesn’t necessarily mean that you should reverse or exit your trades. Divergences should be used as warnings of a potential reversal in trend instead of a continuation.
Awesome Oscillator Saucer
Let’s be honest here, missing out on opportunities leads to regret and taking bad decisions. Then how can tackle this?
A trading signal used by many traders, the Awesome Oscillator Saucer is used to identify potential rapid changes in momentum. So if you missed the boat on a trend signal, then the AO Saucer will give you a second chance to enter a trend!
The saucer setup is formed by 3 consecutive bars on the AO histogram either above the zero line or below the zero line. The AO saucer can be Bullish or Bearish. A bullish saucer happens when the following four conditions are satisfied:
- The AO histogram is above the zero line
- We have 2 consecutive red bars
- The second red bar is lower than the first bar
- The third bar is green and higher than the second bar
A bearish saucer happens when the following four conditions are satisfied:
- The AO histogram is below the zero line
- We have 2 consecutive green bars
- The second green bar is higher than the first bar
- The third bar is red and lower than the second bar
Many traders will seek to enter a buy position either during the third bar or in the bar which immediately proceeds the third bar – providing that it is also green. A lot of traders will use a stop on their position to manage their risk.
The Twin Peaks
This a commonly used oattern in the Awesome Oscilaltor and you can derive buy and sell signals. The Twin Peaks produce either Bullish or Bearish signal depending whether it is below or above the zero line respectively.
A bullish twin peak is when there are two peaks in momentum below the zero line. Some traders believe that a green bar after the second peak – which must be higher than the first peak – signifies that there will be a break above the zero line. For the pattern to be valid, the trough between the two peaks must not break above the zero line. The green bar will often serve as a buy signal, with traders trying to ride the upward momentum to achieve a profit. The price chart below gives an example of a bullish twin peak awesome oscillator pattern.
A bearish twin peak is when there are two peaks made up of green bars above the zero line. The second peak will have to be lower than the first peak for the signal to be correct, and a red bar must immediately follow the second peak. The trough between both peaks must not break below the zero line, otherwise the signal is invalid. The red bar that proceeds the second peak will serve as a sell signal, at which a trader using this strategy will choose to open a short position. The price chart below gives an example of a bearish twin peak awesome oscillator pattern.
Bottom Line
The Awesome Oscillator shows us very clearly what’s happening to the market. It is one of the best momentum indicators and can be applied across different styles of trading, including day trading and swing trading.
You need to test out the indicator and see if it suits your style and once interpreted correctly and used wisely, it will help you take meaningful trades on your stocks.
The creator of the awesome oscillator, Bill Williams, has also developed a number of other indicators which you might find useful, like Alligator and Fractal Chaos Bands.


