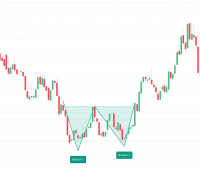
A double bottom is a bullish reversal pattern that forms after a significant downtrend. The pattern is created when the price action tests a…
Technical Indicators
Know about more than 70 indicators
Double Top Pattern: Here’s What You Need To Know
The double top pattern is a bearish reversal pattern that is created after an extended uptrend. When the price makes two successive highs that…
Bullish Engulfing Pattern – All you need to know
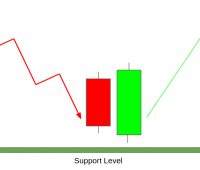
What is a Bullish Engulfing Pattern? Bullish engulfing pattern is a simple candlestick pattern which gives early indication of trend reversal from bearish to…
3 Volume Indicators every trader should know
When it comes to technical analysis, one of the most important concepts to understand is volume. Volume (Vol.) is simply the number of shares…
Is Iron Condor better than short straddle options strategy?
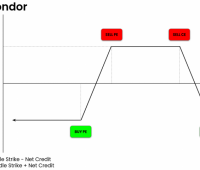
In this article, we are going to learn about Iron Condor (Short Iron Condor). We will learn about its theory, benefits and we will…
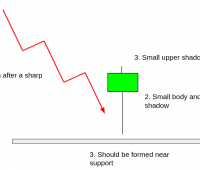
This Simple Trick Could Help You Recognize the Hammer Candlestick Pattern
Introduction to hammer candlestick pattern A hammer candlestick is a type of candlestick pattern that is used to signal a bullish reversal in the…
Trading with Greeks on Streak – Part 3 (Delta)
Why should we learn about Delta Options is a derivative product that means it derives its value from that of the underlying. To understand…
Trading with Greeks on Streak – Part 2 (Theta Decay and Time Value)
Options are a depreciating asset, meaning that their value decreases with time.In option pricing, time is extremely crucial. Changes in time have a significant…
Choppiness Index Indicator
Close your eyes…no wait…read the sentence first – close your eyes and imagine that you know exactly ‘on the very first tick’ that the…
PROC
As the gives away the entire purpose of the indicator, the Price Rate of Change (PROC) measures the percentage change in price between the…


