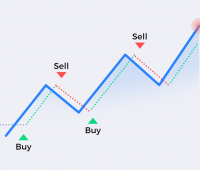
Overbought and Oversold technique is very useful for trading in sideways markets and getting favorable entries in trending markets. When the market is overbought,…
Indicators
All articles related to technical indicators
Decoding the Donchian Channel
This is an overlay indicator that creates a band around the price. The upper band is N period high and the lower band is…
Advanced Comparative Relative Strength Concepts
Learning about indicators and concepts is the first step towards educating ourselves. However, in order to become skilled at technical analysis, we must learn…
How to trade using Supertrend
How to trader using the Supertrend indicator and how to create a simple strategy in Streak.
Understanding the Stochastic Oscillator and creating a mean-reversion strategy in Streak
Intraday traders love momentum. Momentum allows traders to enter and exit their position quickly with a profit/loss. There are various indicators that traders use…
Understanding Moving Averages and Creating Strategies
Introduction : Moving Averages are one of the simplest indicators to understand, calculate, and use. They have been around for a very long time. Moving…
2 Ways to use Moving Average Envelopes
Introduction : Moving Average Envelope is formed by plotting a certain fixed or percentage-based range above and below a moving average with percentage-based envelopes…
Understanding Heikin Ashi charts and its pitfalls
One of the major pain points that traders face while looking at a chart is understanding the trend. Sometimes the price is going up,…
Ichimoku Cloud Simplified: Lagging Span and Look-ahead Bias
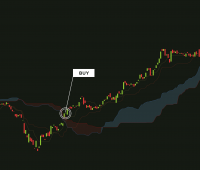
Ichimoku Kinko Hyo or Ichimoku cloud was developed around the late 1930s by Goichi Hosoda, a Japanese journalist, and was published in his 1969…
Understanding Renko Charts and things to know while using them on Streak
A Renko chart is a type of chart or a technical tool that is built by only using price data. The name Renko means…


