CCI = (Typical Price – Simple Moving Average) / (0.015 x Mean Deviation)
Nope! Didn’t mean to start jump start with the formula. Instead, here is another trend indicator built on top of the Moving Averages and Deviations. So, if you haven’t read about Moving Averages, now is the time!
Okay. Since you’re here, means you either know about Moving Averages or you just read about it.
What is Commodity Channel Index aka CCI
The CCI is a momentum-based oscillator that helps to determine when a stock is overbought or oversold, spotting new trends and spotting weakness in trends when the indicator diverges with the price. It measures the difference between the current price & the historical average price. It assesses the price, trend direction & strength, and helps determine if you want to enter or exit a trade, refrain from taking a trade, or add to an existing position.
Like many other indicators, there is complex math behind the CCI. To be honest, you don’t want to be bored with the formulas. So let’s talk about what the CCI tells you or how to interpret it. Open up your price charts ASAP and apply the CCI to your favorite stock!
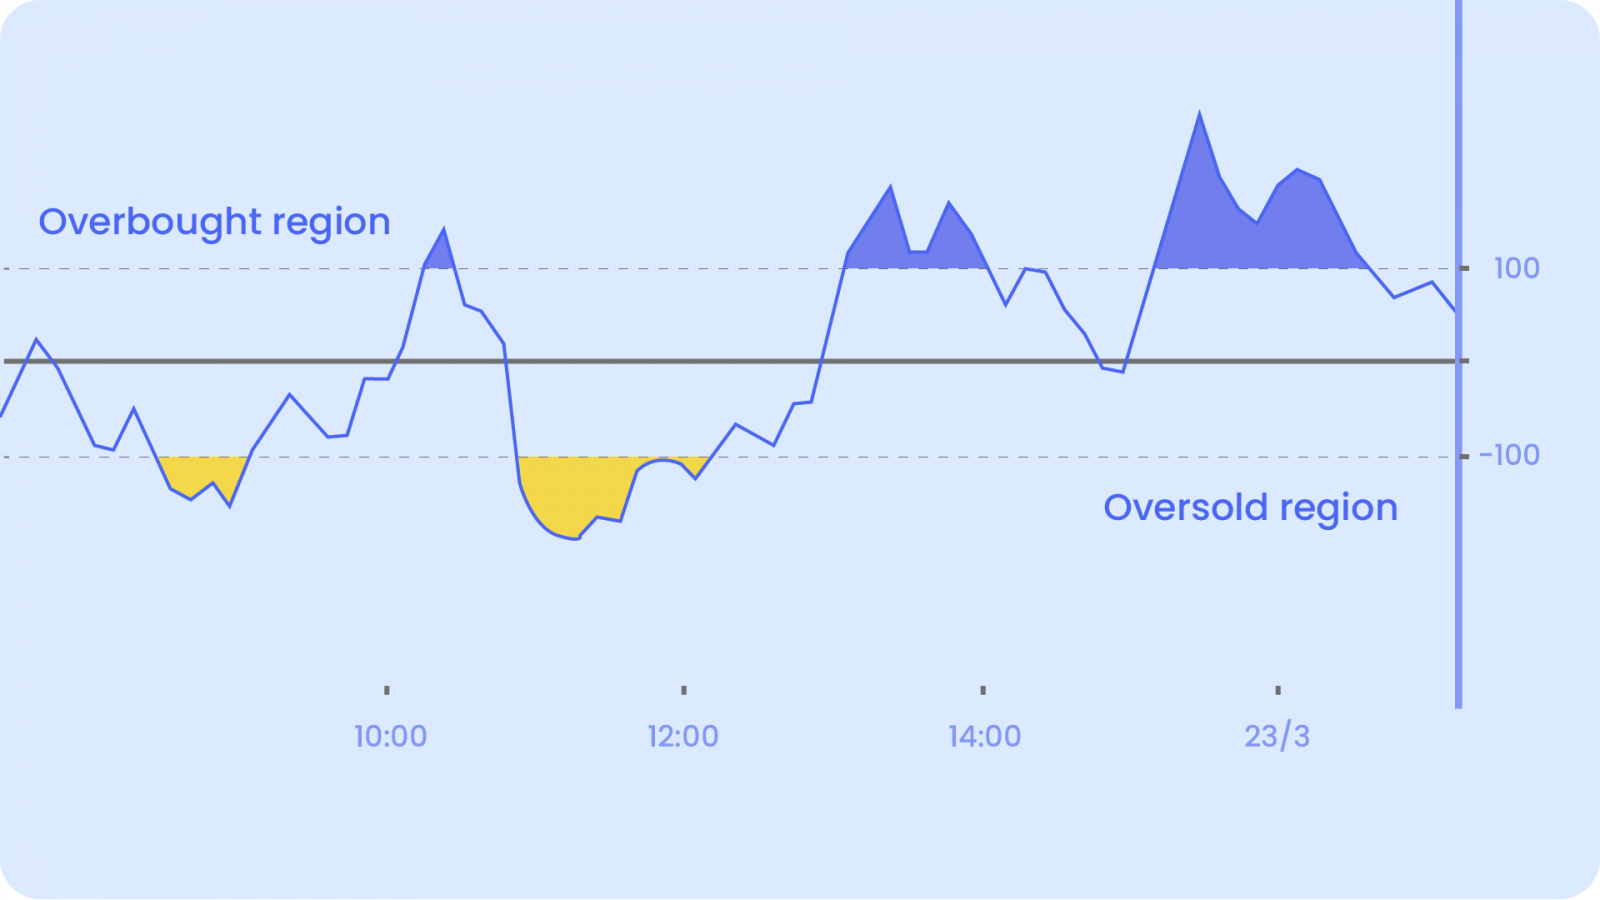
You’ll see that the CCI is a line below the price chart. The indicator fluctuates above or below the zero line, moving into positive or negative territory. Approximately 75%, fall between -100 and +100. And about 25% of the values fall outside this range. This indicates unusual strength or weakness that can foreshadow an extended move.
When the CCI moves from negative or near-zero territory to above 100, that may indicate the price is starting a new uptrend. Once this occurs, traders can watch for a pullback in price followed by a rally in both price and the CCI to signal a buying opportunity.
Another important thing to note is that the overbought or oversold levels are not fixed since the indicator is unbound. Therefore, you should look past readings on the indicator to get a sense of where the price reversed. For example, a stock may reverse near +200 and -150. While another stock may tend to reverse near +325 and -350.
Bullish/Bearish Divergences
Divergences signal a potential reversal point because directional momentum does not confirm the price. A bullish divergence occurs when the price makes a lower low and CCI forms a higher low. This shows less downside momentum. A bearish divergence forms when the price records a higher high and CCI forms a lower high. This shows less upside momentum. Now don’t get excited. Divergences are not absolute. They can be misleading. For example, a strong uptrend can show multiple bearish divergences before a top can materialize. And the same can happen with a downtrend.
Limitations of Using the Commodity Channel Index (CCI)
While you can sometimes spot the overbought or oversold conditions at a perfect time, the CCI is highly subjective. It is also lagging and leads to whipsaws and might give poor signals. For example, a rally to 100 or -100 to signal a new trend may come too late. By then, the price has run its course and is starting to correct already. Hence, always confirm your trades with the help of complementing indicators and create a proper trading strategy.
Happy Trading! 😄


