A double bottom is a bullish reversal pattern that forms after a significant downtrend. The pattern is created when the price action tests a key support level twice and fails to break below it. This creates a “W” shaped pattern on the chart that is used by traders to signal a potential reversal in the trend.
The double bottom pattern is a relatively simple one to identify and trade. The key is to wait for a confirmed breakout above the resistance level created by the pattern. In this article, we will discuss how to identify and trade the pattern.
How to identify a Double Bottom Pattern
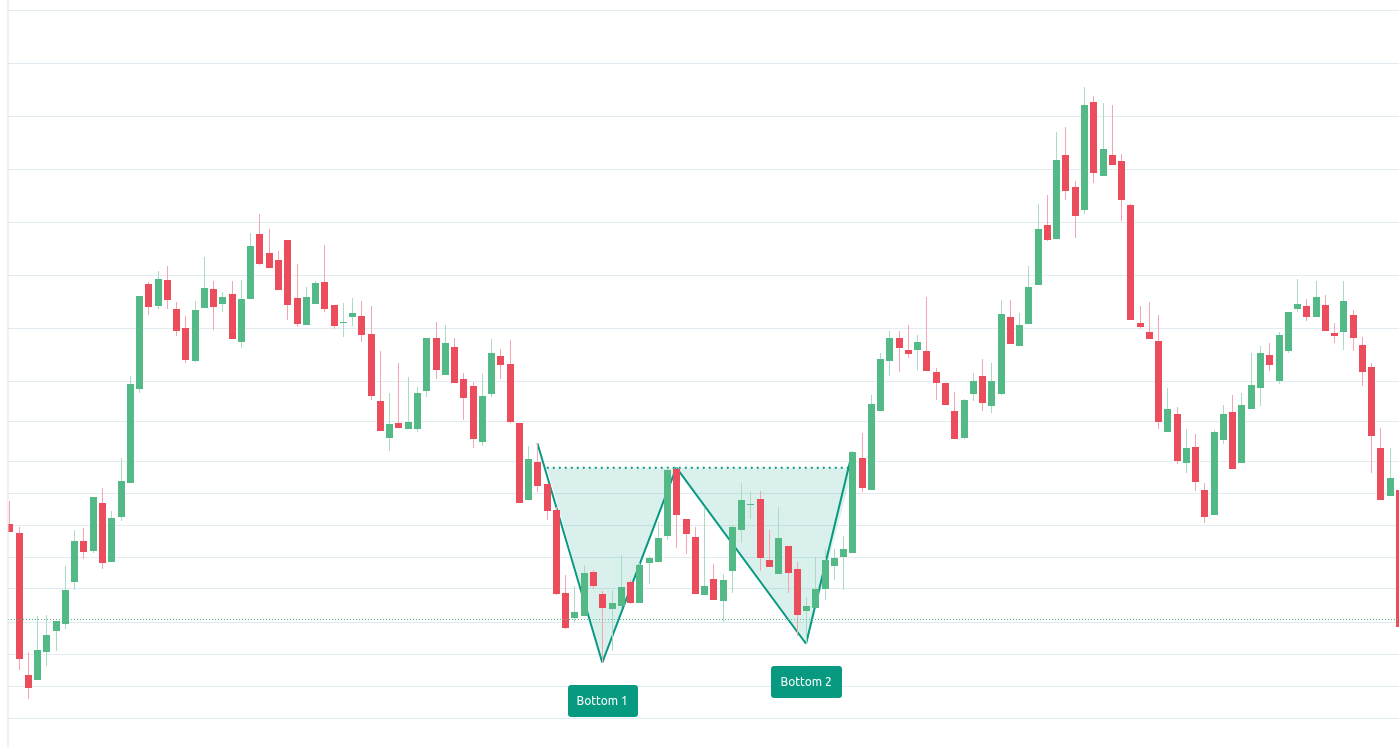
A double bottom pattern is a classical pattern that indicates a change in trend and a shift in momentum from bearish to bullish. It is composed of two consecutive troughs that bottom out at roughly the same price level. This level acts as a support for the price. The double bottom formation is a bullish reversal pattern that is created after a prolonged downtrend. In order to identify this pattern, you will need to look for the following:
1. Two distinct troughs that bottom out at roughly the same price level.
2. A moderate rally in between the two troughs, creating a resistance.
3. A break above the resistance after the 2nd trough is formed.
If you see a chart with these characteristics, you have recognized a double bottom pattern.
This pattern is regarded as a very reliable reversal signal, and traders frequently use it to enter long positions.
How to trade the double bottom pattern?
Traders with a very high risk appetite may start entering in small quantities if they spot bullish reversal candlesticks at the resistance level when the second trough (Bottom 2) is forming with a strict stop loss below the support formed above the 1st bottom. If the price breaks below the 1st bottom, it can move downwards very quickly. Traders may enter the trade completely only once the resistance level is breached by the price. Often, the stock will give a throwback to the breakout level after the breakout. Entering after the throwback gives better risk/reward.
If the pattern fails to breakout, there is a probability that the pattern turns out to be a rectangle pattern.
How to calculate the stoploss and target?
As with the majority of classical chart patterns, the target price is calculated by finding the height of the pattern and then projecting it upwards from the breakout level. In this case, the height of the pattern will be projected upwards from the resistance level. Traders can either exit the entire quantity or partially exit and trail the remaining quantity.
The stop loss can be placed right below the tops. For a better risk/reward, traders can also place the stoploss at half the target amount to maintain a risk/reward of 1:2.
Scanning for potential double bottoms with Streak
Link: https://public.streak.tech/in/hPjRBXnaTp
This simple scanner can assist you in searching for stocks that form a double bottom pattern. The scanner is appropriate for daily timeframe. With minor modifications, the same scanner will work in shorter time frames as well. For shorter time frames, reduce the 1.02 and increase the 0.98 values. For example, 1.01 and 0.99 can be used for hourly time frames. If you have any questions or concerns, please contact us at [email protected]. We will be happy to help you within a few hours.
Summing It all Up
The double bottom formation is a bullish reversal pattern that is created after a prolonged downtrend. It is composed of two consecutive troughs that bottom out at roughly the same price level. The key is to wait for a confirmed breakout above the resistance level created by the pattern. Traders with a very high risk appetite may start entering in small quantities if they spot bullish reversal candlesticks at the resistance level. If the pattern fails to breakout, there is a probability that the pattern turns out to be a rectangle pattern. The target price is calculated by finding the height of the pattern and then projecting it upwards from the breakout level.


