How to Read Candlesticks? Candlestick charts are a type of graphical depiction of a financial instrument’s price fluctuations, such as a stock, currency pair, or commodity. Candlestick charts were developed in Japan in the 18th century and are now frequently utilised by traders and investors. They give more information than basic line or bar charts since they indicate not only the opening and closing prices for each time period, but also the high and low prices and the direction of the price movement.
In this article, we will explain how to read candlesticks and how to use them to identify common chart patterns that can help you anticipate future price movements and make better trading decisions.
The Anatomy of a Candlestick

A candlestick consists of two parts: the body and the shadow (or wick). The body is the rectangular part that shows the difference between the opening and closing prices for a given time period. The shadow is the thin line that extends above and below the body and shows the highest and lowest prices for that time period.
Impact of color
The color of the body indicates whether the price closed higher or lower than it opened. A green (or white) body means that the price closed higher than it opened, indicating bullish (upward) momentum. A red (or black) body means that the price closed lower than it opened, indicating bearish (downward) momentum.
Impact of body and shadow/wick length
The size of the body and the shadow can vary depending on how much the price moved during the time period. A long body indicates a strong price movement, while a short body indicates a weak price movement. A long shadow indicates a lot of volatility or uncertainty, while a short shadow indicates a stable or decisive market.
Basic Candlestick Patterns

Candlestick patterns are formations of one or more candlesticks that signal potential price movements or reversals. There are many candlestick patterns, but we will focus on some of the most common and useful ones.
Bullish Engulfing: This pattern consists of two candlesticks: a small red one followed by a large green one that completely engulfs the previous one. This pattern indicates that buyers have taken control of the market and are likely to push the price higher.
Bearish Engulfing: This pattern is the opposite of bullish engulfing. It consists of two candlesticks: a small green one followed by a large red one that completely engulfs the previous one. This pattern indicates that sellers have taken control of the market and are likely to push the price lower.
Hammer: This pattern consists of a single candlestick with a small body and a long lower shadow. The upper shadow is either very short or nonexistent. This pattern indicates that sellers tried to push the price lower, but buyers stepped in and drove the price back up, creating a hammer-like shape. This pattern suggests that buyers are gaining strength and a possible reversal is in sight.
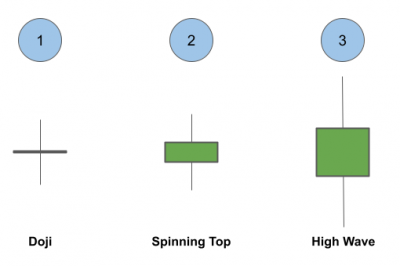
Doji: This pattern consists of a single candlestick with a very small or nonexistent body and equal upper and lower shadows. This pattern indicates that there is indecision or equilibrium between buyers and sellers, as neither side was able to move the price significantly. This pattern can signal a pause or a change in direction depending on the context.
How to Read Candlesticks and Chart Patterns
Candlestick charts can help you identify trends, support and resistance levels, breakouts, reversals, and other important signals for trading. However, you should not rely on candlestick patterns alone, as they are not always reliable or accurate. You should always use other technical indicators, such as moving averages, trend lines, volume, etc., to confirm your analysis and validate your trading signals.
Typical Mistakes to Avoid
There are common mistakes that beginners can still make even after learning to read candlesticks. The following list of common mistakes includes directions on how to avoid them:
- Overemphasizing one candlestick: It’s important to consider the whole picture rather than just one. Before you make any decisions, analyse the trends and other patterns.
- Not paying attention to the volume: The volume is a key factor in confirming the trend. Along with candlestick patterns, volume should also be considered.
- Ignoring multiple time frames: Examine multiple time frames to gain a more comprehensive view of the market. For example, daily candlesticks can be used to identify long-term trends, hourly candlesticks can be used to identify short-term opportunities, and 15-minute candlesticks can be used to fine-tune your entry and exit points.
- Ignoring Key Levels: Look for patterns that occur near significant levels, such as support and resistance lines, trend lines, pivot points, etc., as they are more likely to have an impact on price movements.
How to backtest candlestick strategies?
With the help of the Streak platform, backtesting candlestik strategies is pretty simple. Let us take an example of a strategy and backtest it on historical data to see the results.
Sample Strategy Details

Entry: Buy when a Bullish Engulfind candlestick pattern is formed just above DEMA 9 (Candle low lower than DEMA 9 but close above DEMA 9)
Exit: 1% Stoploss, 2% Target

Strategy Link: https://public.streak.tech/in/MuO2hJ6e3A
Likewise, you can develop and backtest your own strategies. You can also create a scanner to scan for all the stocks forming this pattern. For any assistance, you can write to us at [email protected]
Conclusion:
Candlesticks help traders and investors to understand how the price of a financial instrument such as a stock, currency, or commodity changes over time. They show more details than simple line or bar charts, such as the opening and closing prices, the high and low prices, and the direction of the price change. The body and shadow of a candlestick show the difference between opening and closing prices and the highest and lowest prices for a certain time period. Different colors, sizes, and shapes of candlesticks show different market moods and patterns.
Candlesticks can be helpful in finding trends, support and resistance levels, and other important signals for trading, but they should not be the only tool. Other technical indicators, such as moving averages, trend lines, and volume, should be used to confirm trading signals. It is important to avoid common errors such as focusing too much on one candlestick, ignoring the volume, and not looking at multiple time frames.
Disclaimer: The information provided is solely for educational purposes and does not constitute a recommendation to buy, sell, or otherwise deal in investments.


