The Moving Average Convergence Divergence aka The Good Old MacD – I’m lovin’ it! This is a really popular trend-following momentum indicator. You must have noticed that trading in the direction of short-term momentum can prove to be stressful. And so, incorporating a powerful indicator into your trading strategy can prove to be so useful. Although MACD solves a lot of purposes, there’s a lot more to it than meets the eye.
Let’s deep dive. Shall we?
The MATH behind MACD
MACD is built out of Moving Averages. Now, MACD is all about convergence and divergence. The name itself is screaming it out loud enough. If you’re a beginner, you must be thinking about what these words mean in the world of trading. Convergence occurs when the moving averages move towards each other. Divergence occurs when the moving averages move away from each other.
Let’s see what exactly contributes to this indicator:
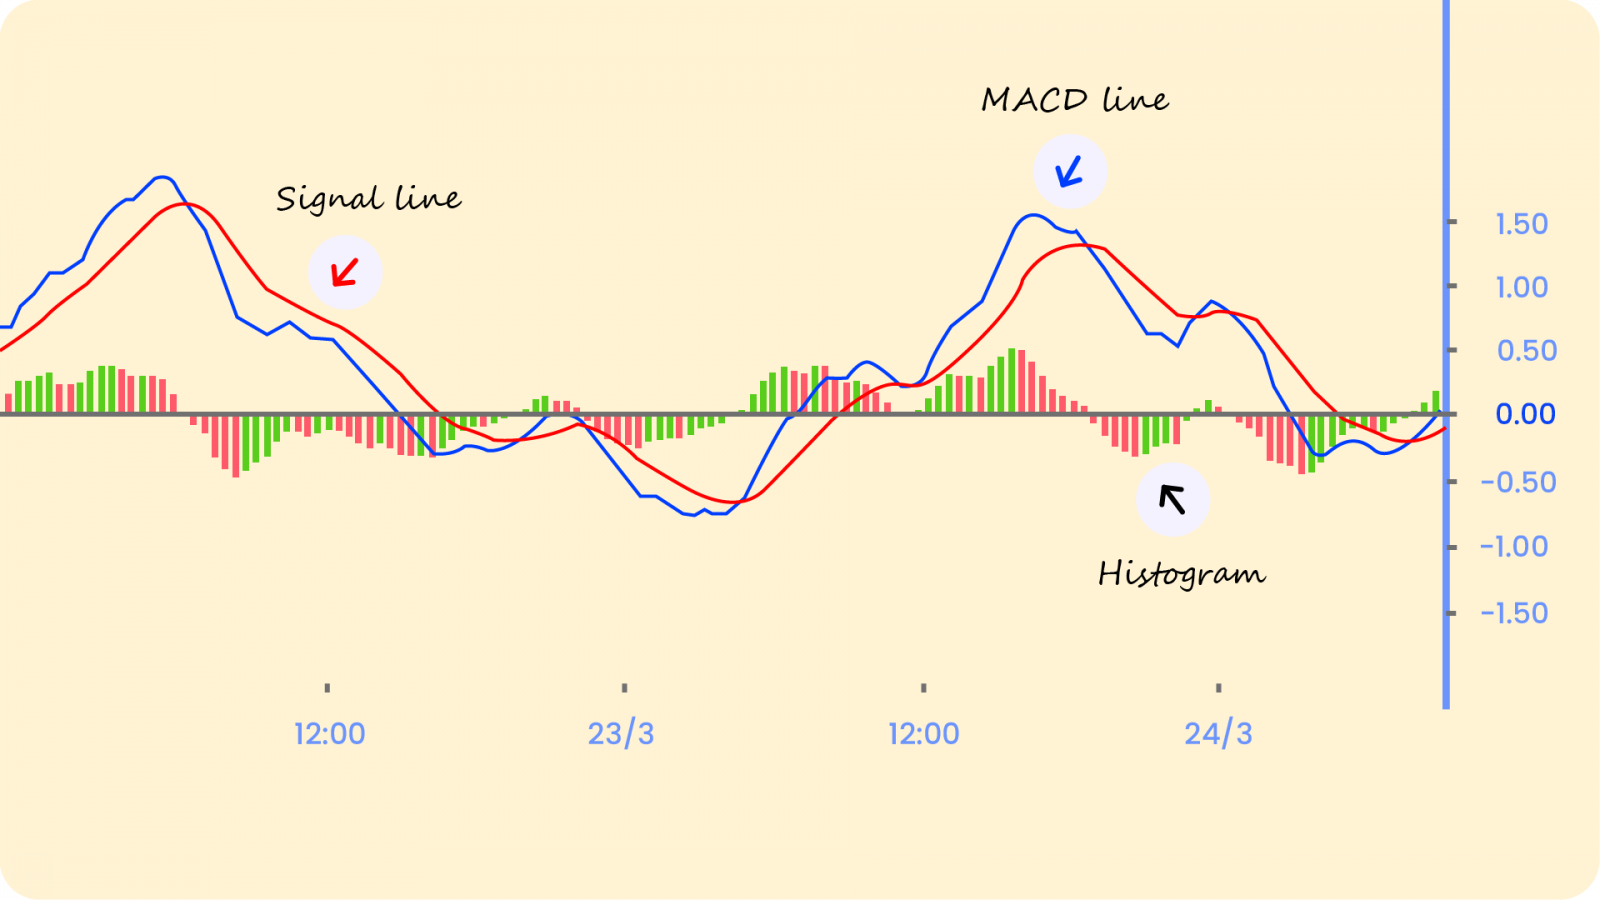
- The MACD Line – This is calculated by subtracting the 26-day EMA (known as the slow-line) from the 12-day EMA (known as the fast-line). This acts like a more responsive line compared to the Signal Line.
What it tells us: When the MACD Line crosses above the baseline, it is considered as Bullish and if it crosses below baseline, it is considered Bearish.
- The Signal Line – This is nothing but the 9-period EMA of MACD itself.
What this tells us: If you see the MACD Line crossing above the Signal Line, it represents a bullish trend and can be a possible buy signal. On the other hand, if you see the MACD Line crossing below the Signal Line, it represents a Bearish trend or a possible sell signal.
But does this remind you of something? It’s just like a Moving Average Cross-Over. And those rules apply here, too. As a moving average of the indicator, the Signal Line trails the MACD and makes it easier to spot MACD turns.
- Histogram built on the Zero Line – The bars on the histogram show the distance between the MACD Line and Signal Line. If the MACD Line is above the Signal Line, the histogram will be above the MACD’s baseline. If the MACD Line is below its Signal Line, the histogram will be below the MACD’s baseline. And the longer the bars, the stronger the trend! Centerline crossovers can last from a few to multiple candle intervals depending on the strength of the trend.
Most Common Trading Strategy for MACD:
- Buy strategy: If you want to buy when the MACD crosses above the MACD Signal line then use MACD(12,26,9) crosses above MACD Signal(12,26,9)
- Sell strategy: If you want to sell when the MACD crosses below the MACD Signal line then use MACD(12,26,9) crosses below MACD Signal(12,26,9)
…explain more sensitive and less sensitive examples…
It is important to understand that the Shorter EMA (12-day) is faster and responsible for most MACD movements. The Longer EMA (26-day) is slower and less reactive to price changes. While the MACD Line is above the Zero Line, it means that the upside momentum is increasing. And if it is below the Zero Line, it means that the overall momentum is decreasing.
Divergences
It takes a strong move in price to push the momentum to either extreme. Now, even though the move may continue, the momentum can’t continue forever. And this will usually produce multiple Signal & MACD Line Cross-Overs at the extremities. You should look out for such instances and act carefully. Volatile markets might also cause such crossovers to take place. This brings us to the most important topic – Divergences!
In simple words when the price of a stock is moving in one direction and the MACD’s Line is moving in the other, it’s called a Divergence.
There are 2 types of divergences to talk about:
- Bullish Divergence – Sometimes the MACD Line forms two rising lows that correspond with two falling lows on the price while ‘continuing the Bullish signal.’
- Bearish Divergence – Sometimes the MACD Line forms two rising highs that correspond with two falling highs on the price while ‘continuing the Bearish signal.’
Basics are out of the way! It’s time to know how to interpret MACD Divergences. And you don’t want to miss out on this as most traders are misguided by the MACD signals.
And we also know that divergence occurs after almost every big move. If you assume that divergence, in this case, means a reversal is coming, you should think twice. No, maybe more – a hundred times! You could get yourself into a lot of losing trades.
- Problems With Divergence Between MACD Highs (or Lows)
Dang! If you’re already looking at the MACD indicator on your price charts, you’ll relate to this ASAP. We usually, as humans, have a few trading biases. We tend to compare past data and assume that the same would happen in the future. Sadly, history doesn’t repeat itself in this case.
You’d find yourself comparing prior highs on MACD with current highs or prior lows with current lows. For example, if the price moves above a prior high, you might end up watching for the MACD to also move above its prior high. And you’ll jump to a conclusion that if it doesn’t go up – that’s a divergence aka a traditional warning signal of a reversal.
Stop! You need to think again. This is very similar to what we discussed earlier. MACD just shows the momentum or the rate of change of price or how strong a trend is. The price might still be in an uptrend and the MACD will start dipping down, down, and down. Maybe even hit a few Cross-Overs. And end up confusing you for eternity.
Understand carefully… A stock’s price can move higher or lower, slowly, for very long periods. If this occurs after a steeper move (more distance covered in less time), then the MACD will show divergence for much of the time the price is slowly (relative to the prior sharp move) marching higher. If you assume that a lower MACD high means the price will reverse, you might lose an opportunity to stay long and collect more profit from the slow(er) march higher. Or worse! You might take a short position into a strong uptrend, with little evidence to support the trade except for an indicator that isn’t useful in this situation.
MACD divergences may be present for an entire day whilst the price is dropping. And if you’re a Day Trader, you can miss an entire day of profits.
The Bottom Line – Trend and Price Action are Gods
MACD divergence – on its own – doesn’t signal a reversal in price, at least not with the precision required for day trading. The MACD is not particularly good for identifying overbought and oversold levels. Even though it is possible to identify historically overbought or oversold levels, the MACD does not have any upper or lower limits to bind its movement. During sharp moves, the MACD can continue to over-extend beyond its historical extremes.
But this doesn’t mean the indicator can’t be used. IT IS STILL special because it brings together momentum and trend in one indicator. This unique blend of trend and momentum can be applied to daily, weekly, or monthly charts.
That said, always be aware of the pitfalls, and don’t use the indicator in isolation. Focus more on price action and trends instead of MACD divergence. For a downtrend to reverse, the price must make a higher swing high and/or a higher swing low. Similarly, for an uptrend reverse, the price must make a lower swing high and/or a lower swing low. Until these occur, a price reversal is not present! Whether divergence is present or not isn’t important. You make money only off-price movements, not MACD movements.
Happy Trading! 😄


