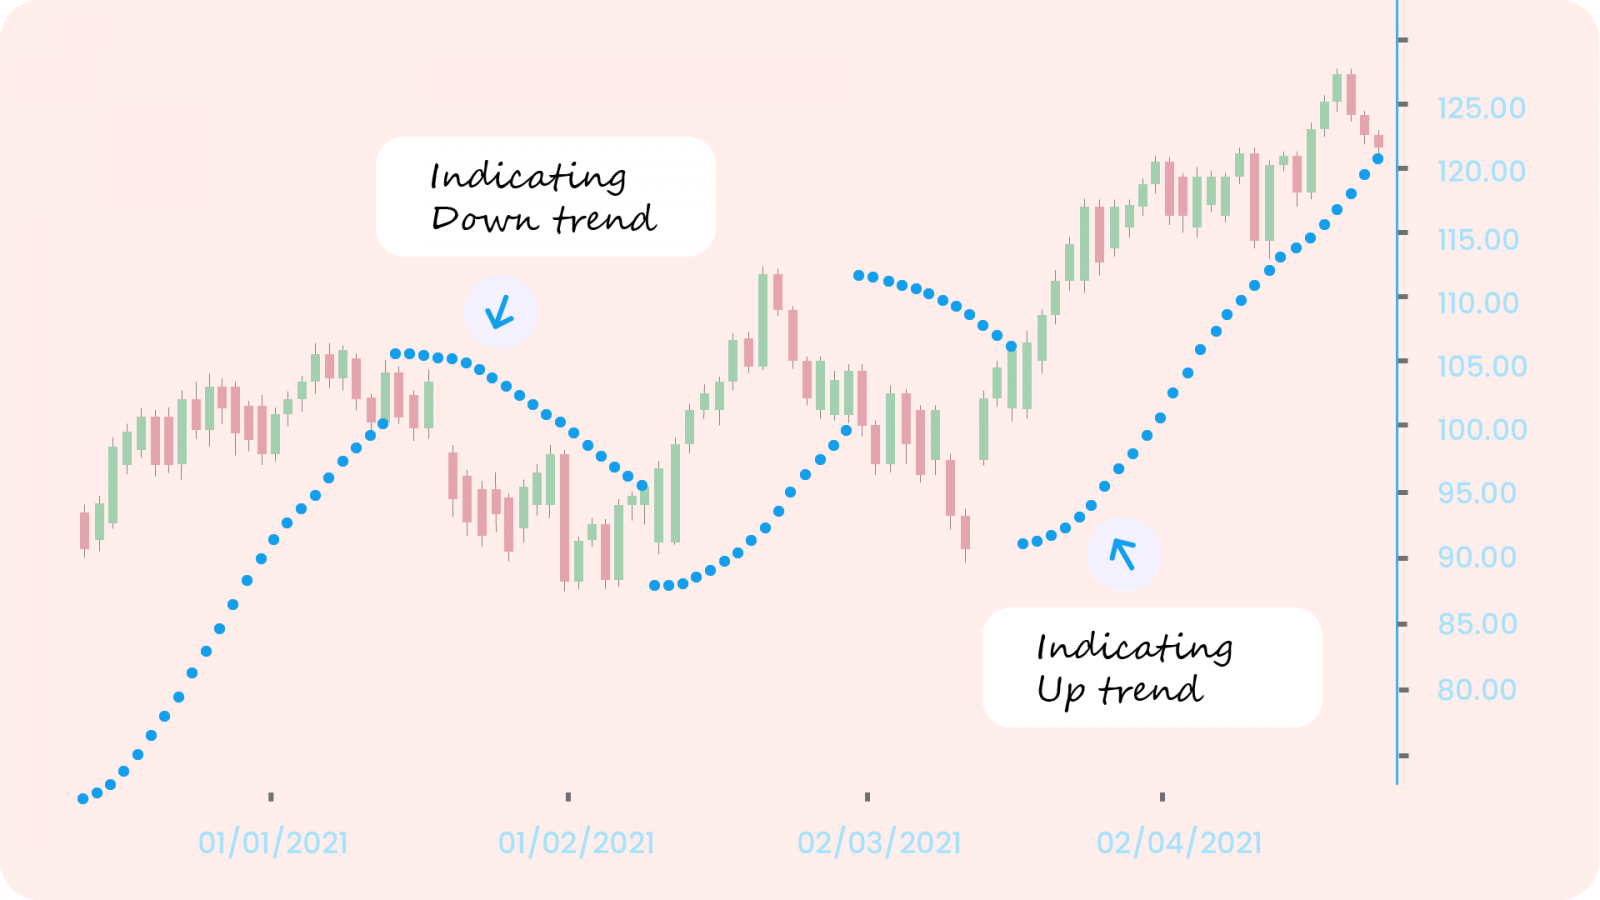
The Parabolic SAR aka the Stop and Reverse indicator. But the developer of this indicator, JW Wilder, preferred to call it the Parabolic Time/Price System. The SAR indicates that: this is the point at which you should exit a Long Trade and enter a Short Trade or vice versa. Hence, it is a major tool for identifying trend reversals.
Here’s for the Geeks
Most indicators have rather complex formulas behind them. Sometimes its good to know the math. But what’s more important is to know how they work with trends. You should understand how the different settings effect the signals, too.
To begin with, the SAR is calculated based on the previous day’s SAR. During am uptrend, it is calculated based on previous day’s high. And during downtrends, it is calculated based on previous day’s low. The highest and lowest points are known as EP aka Extreme Points. The calculation also takes into an Acceleration Factor aka AF. Now you may ask, how to calculate the very first SAR? The answer is It can be calculated based on the last EP before a market trend reversal.
The math behind uptrends: SAR = Prior SAR + AF x (Prior EP – Prior SAR)
The math behind downtrends: SAR = Prior SAR – AF x (Prior SAR – Prior EP)
- EP = Highest high for an uptrend & lowest low for a downtrend (updated each time a new EP is reached)
- AF = Default of 0.02, increasing by 0.02 each time a new EP is reached, with a maximum of 0.20. An AF higher than 0.2 will result in greater sensitivity while an AF lesser than AF will result in lesser sensitivity.
This calculation creates a dot on the chart and help identify the current price direction.
Interpretation of the Parabolic SAR
Now that we have the geeky stuff out of the way, let’s try to understand the signals SAR gives us. So, when the price falls below the rising dots, the dots flip on top of the price bars. And when the price rallies above the falling dots, the dots flip above the price bars. The ‘flipping’ of dots signify trend reversals. As the price of a stock rises, the dots will rise as well, first slowly and then picking up speed and accelerating with the trend. The SAR starts to move a little faster as the trend develops, and the dots soon catch up to the price.
The most important functionality that the SAR solves is to determine dynamic stop-loss. While a price is moving along a market trend, you’ll want to increase your target profit and set the stop-loss even higher. This will alow you to book the profits of increase in price. This is also as setting up a trailing stop-loss.
Using the Parabolic SAR in Conjunction with Other Indicators
No indicator is 100% accurate. Also, you need to combine each indicator with other complementary indicators to get a confirmed signal about trading decisions. The Parabolic SAR may work best with the following:
- Moving Average: The sell signals become much more convincing when the price is trading below a long-term moving average. The price below a long-term moving average suggests that the sellers are in control of the direction and that the recent SAR sell signal could be the beginning of another wave lower.
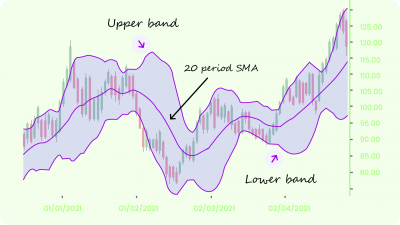
- Other ndicators that use moving averages, such as Moving Average Convergence Divergence (MACD) & Bollinger Bands, can be used to confirm the buy and sell signals that manifest during parabolic SAR crossovers. The same is true for the Average True Range (ATR), which can help you measure market volatility to evaluate not only the potential price movement driven by a trend but also whether the current market conditions are properly served by the parabolic SAR.
- Trendlines: If there is a trend, only take trade signals in the direction of the overall trend. For example, if the trend is down (based on your analysis), only take short trade signals—when the dots flip on top of the price bars—and then exit when the dots flip below the price bars. In this way, the indicator is utilized for its strength: catching trending moves.
- ADX: Combining the parabolic SAR with other momentum indicators that gauge a trend’s strength will help you determine when to enter & exit trades to incur the least amount of risk. Wilder used the parabolic SAR in conjunction with his Average Directional Index (ADX) to confirm a trend’s direction and momentum before entering or exiting a position.
- On-Balance Volume/OBV – The PSAR doesn’t consider the trading volume and so it doesn’t give much information about the strength of a trend. Although big market movements cause the gap between each dot to widen, that should not be taken as indicative of a strong trend. Using a volume indicator along with the PSAR can prove to be really helpful.
Pros and Cons of the Parabolic SAR
The major limittation/con of the SAR lie in the fact that the dots are still plotted during a ranging market. Hence, it is as good as useless during such times. Another thing to consider is the sensitivity of the indicator, which can be adjusted manually. The higher the sensitivity, the higher the chances of false signals occurring. In some cases, false signals can encourage you to close winning positions too early, selling assets that still have earning potential. Even worse, fake breakouts can give you a false sense of optimism, inducing them into buying too soon.
The main advantage of the indicator is that, during a strong trend, the indicator will highlight that strong trend—keeping you in the trending move. The indicator also gives an exit when there is a move against the trend, which could signal a reversal. Sometimes this ends up being a good exit, as the price does reverse. Other times, it isn’t a great exit because the price immediately begins to move in the trending direction again.
Happy Trading! 😄


