Buy Low. And Sell High. Most traders live by this age-old dogma. And the most critical component for them is to know when a stock is overbought or oversold. RSI aka Relative Strength Index is an important arsenal of indicators to have. So, open up your price charts, apply the RSI and let’s discuss how this indicator works!
Decoding the RSI
Before we jump into the complex interpretations, you need to know one thing. What is Relative Strength? Now, the direction and the strength of price can be compared in two ways:
- By comparing one stock to another stock or index. For example, if a stock is outperforming the NIFTY50, it is showing Relative Strength.
- By comparing the current price of the stock to previous candles of the same stock. This way you can know the momentum of the price.
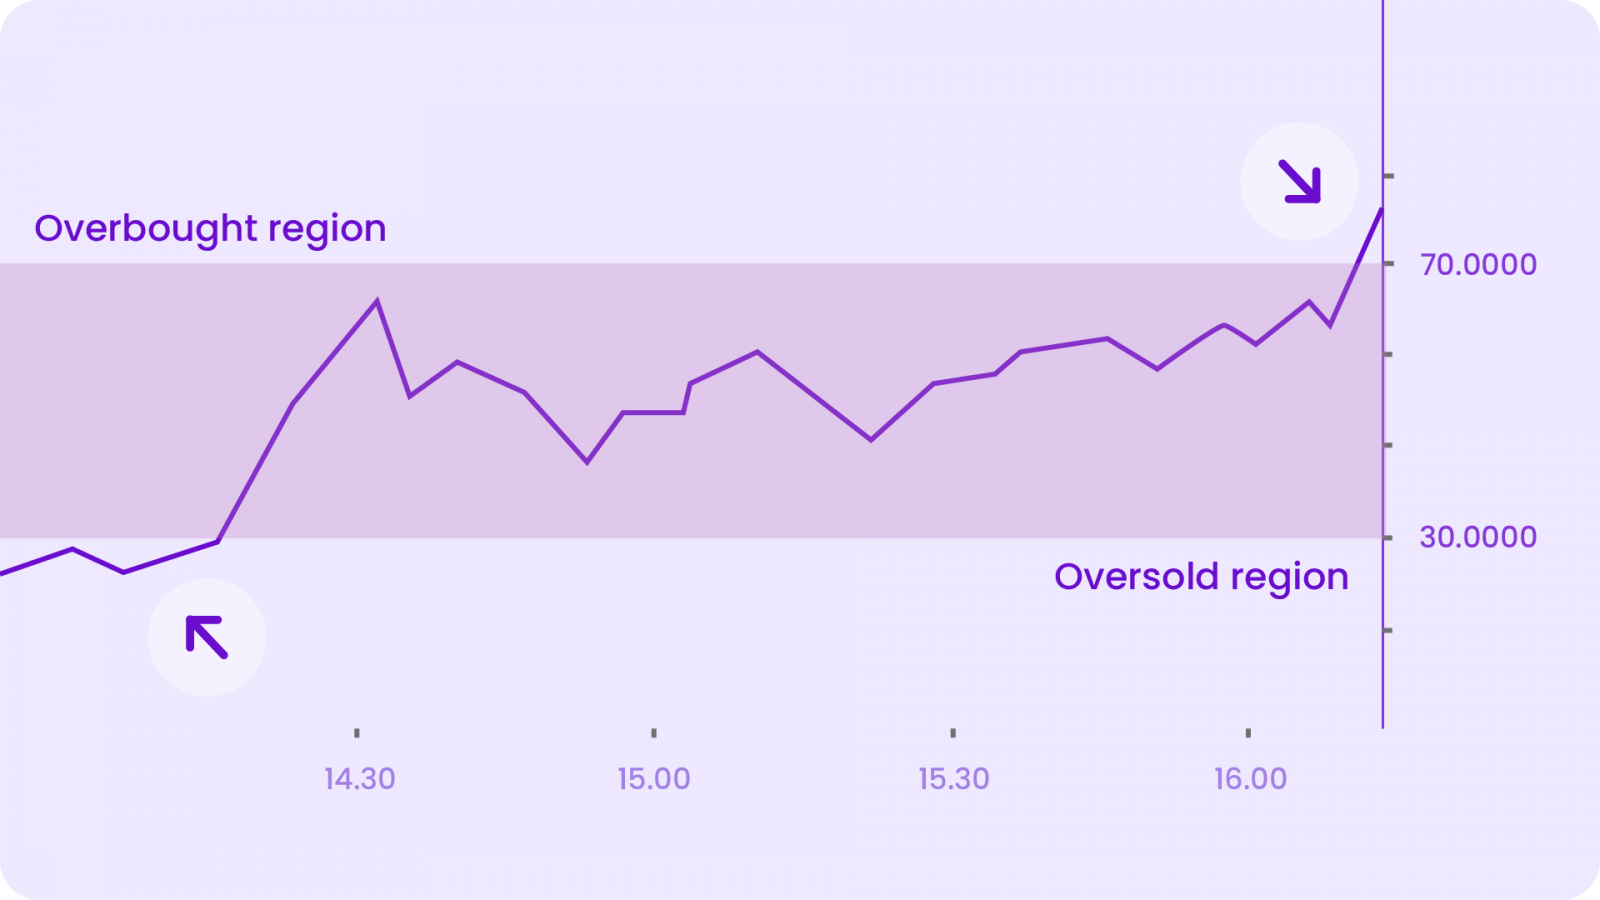
The RSI moves between 0 to 100. And depending on how high on low the value is, it represents whether a stock is overbought and oversold. It takes the price action as the basis of its calculations. The most commonly used RSI is the 14-period RSI with the upper limit as 70 and the lower limit as 30. When the RSI is below 30, the market is getting oversold & might be due for a rally up!
- Overbought: When the RSI is above 70, it means the market is overbought/overvalued. This implies that the stock’s positive momentum is so high that it may not be sustainable for long, and hence there could be a downward correction. If this coincides with a Bearish engulfing pattern, it triggers an investor to go short. But there is a chance that the overbought condition during a strong downtrend can be much lower than 70.
- If a stock is in a continuous uptrend, the RSI might be stuck in the overbought section for a long period. During such times, you might want to go for a sell position, but the stock prices will tell you otherwise. This is because the uptrend is still present but the momentum decreased.
- If the stock slowly starts moving away from the overbought section after a long period of time, it indicates a trend reversal. The stocks may have topped out. Hence, you may look for a selling position.
- Oversold: When the RSI is below 30, the market is getting oversold/undervalued. This indicates that the negative momentum is so high, it could lead to a possible upward reversal or a rally up. If this coincides with a Bullish engulfing pattern, it triggers that the investor needs to go long. But there is a chance that the oversold condition during a strong uptrend can be much lower than 70.
- If a stock is in a continuous downtrend, the RSI might be stuck in the oversold section for a long period. During such times, you might want to go for a long position, but the stock prices will tell you otherwise. This is because the downtrend is still present but the momentum has reduced.
- If the stock slowly starts moving away from the oversold section after a long period of time, it indicates a trend reversal. The stocks may have bottomed out. Hence, you may look for a buying position.
RSI Divergence
Okay, before moving on to the most important part, why don’t you open a trending stock and try to mark the above interpretations. And while you’re at it, you’ll notice a very interesting phenomena known a divergence. It usually happens a lot in the case of momentum indicators like the RSI and the MACD.
- Bullish Divergence – Sometimes, the price makes lower lows but the RSI disagrees with this and forms higher lows. This indicates a strengthening positive momentum. This indicates rising bullish momentum, and a break above oversold territory could be used to trigger a new buy position.
- Bearish Divergence – Sometimes, the price makes higher high but the RSI disagrees with this and forms lower highs. This indicates a strengthening negative momentum. This indicates rising bearish momentum, and a break below overbought territory could be used to trigger a new sell position.
RSI Swing Rejections
Every indicator has more to it than meets the eye. And RSI has its own set of nuances. Sometimes you’ll see a strange pattern while the RSI is reemerging from overbought or oversold territory. There are 2 possible scenarios:
- Bullish Swing Rejection
First, the RSI dips into oversold territory.
Second, the RSI crosses back above 30 (or whatever the oversold limit set by you).
Third, the RSI forms another dip without crossing into the oversold territory.
Finally, the RSI breaks its most recent high.
- Bearish Swing Rejection
First, the RSI crosses above into the overbought territory.
Second, the RSI crosses below 70 (or whatever the overbought limit set by you).
Third, the RSI forms another high without crossing above the overbought territory.
Finally, the RSI breaks its most recent low
Using the RSI this way is very similar to drawing trend lines on the price chart. It is less likely to generate false alarms and works best with long-term trends.
Ps. Don’t get burned! The major limitation of RSI or any momentum oscillators
Correct trend reversal signals are rare. Like really rare! And they also are really difficult to separate from false alarms. A false positive, for example, would be a bullish crossover followed by a sudden decline in a stock. A false negative would be a situation where there is a bearish crossover, yet the stock suddenly accelerated upward.
This Finally Brings us to the Trading Strategy for RSI
- Buy Strategy: If your strategy is to buy when RSI moves out of the Oversold territory, then use: RSI crosses above 30
- Sell Strategy: If your strategy is to sell when RSI moves out of the Overbought territory, then use: RSI crosses below 70
Every trader has a unique way of using the indicators. There a few set rules but you always have to be sure before entering into trades. Never use an indicator in isolation. Always confirm trends. Also, the above topics about DIvergences and Swing Rejections must’ve solved your doubt about – do I buy when the RSI falls below 30 and sell when it rises above 70. You can also use support and resistance lines as well as pivot points to confirm entry and exit points. For example, the entry point would often be an area of support for stock trending upwards & areas of resistance for stocks trending downwards.
Happy Trading! 😄


