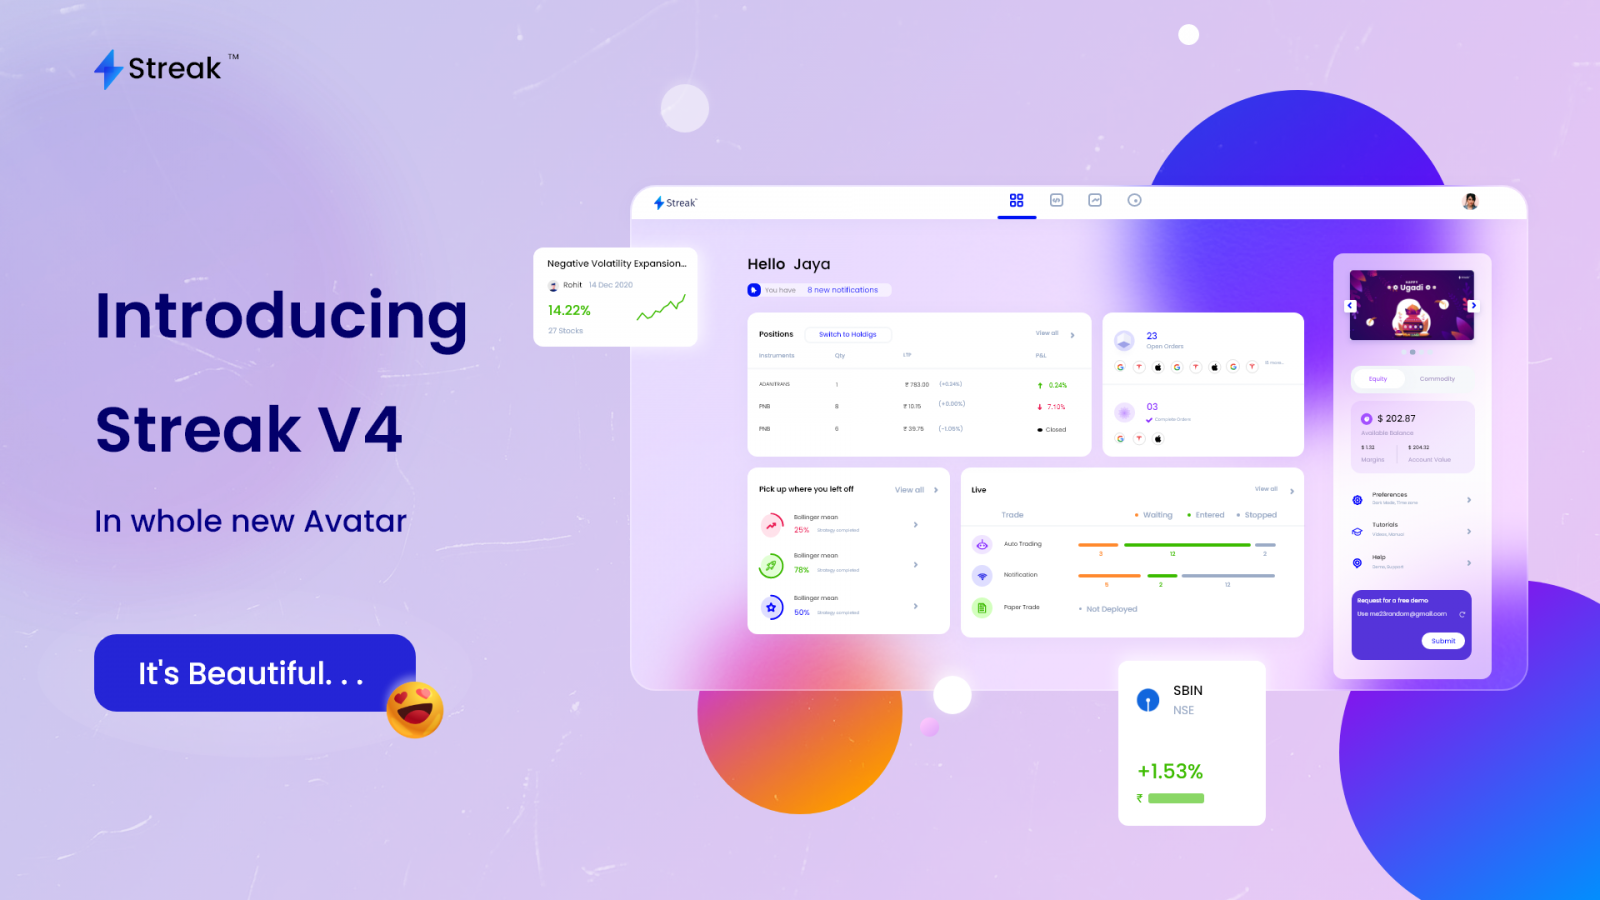
Over the last 4 years, we have spent a lot of time listening to our users and taking continuous feedback from everyone. After spending months on user research combined with all the inputs, we are finally thrilled to announce Streak’s Version 4 Website. This version is a major upgrade from the previous Version 3 and in fact, leaps and bounds ahead since when we started.
To simplify Strategic Trading and make better use of Technical Analysis, the V4 is loaded with new features and a refreshing new user experience. We are yet another step closer to our goals; that is making Streak the most powerful, user-friendly, and intuitive Strategic Trading platform.
Streak is designed to cater to traders beginners and seasoned traders or be it traders who are trying to learn and experiment. It is tailor-made to give a unique trading experience to everyone.
You can bring your trading ideas to life by creating strategies within seconds, running the fastest backtests, and deploying your strategies in the market. You can also scan and search for your favorite stocks and access an exhaustive library of technical indicators. There’s a huge repository of fresh Strategies that you check out to get a hang of how the platform works. You can then run backtests, paper trade, and deploy them, all of it without using code! How cool is that?
And here’s a special launch offer for all our users. Streak will be free for everyone till 30th Nov’21. This means you get 50 backtests, 5 deployments, 50 scans daily!
Let’s look at the 5 major features Streak has to offer! If you already know, then count this as a refresher.
- Technicals – get the direction of any stock across time frames
- Scanners – filter out the basket of stocks that meet your criteria
- Strategies – bring powerful ideas to life
- Backtest – measure your trading ideas within seconds
- Deploy – take your ideas/strategies live in the market or paper trade
Technicals
This is the most basic and simplistic section on Streak. We recommend that you kickstart your journey of Strategic Trading with Technicals. The most important part of the section is Technical Indicators such as SMA, EMA, Hull, etc, and Oscillators such as RSI, MACD, CCI, etc. And you can familiarize yourself in and out with these indicators over here. Once you master this section you can easily transition to creating both strategies and scanners. So what makes the Technical section so special?
- In this section, you can see a real-time technical ‘snapshot’ of each stock you want to track! You can also switch your view to “Support & Resistance” if you’d like.
- The ‘technical depth’ section under each stock just acts like a cherry on top. You can deep dive and go through all the technical indicator values across each time frame such as 1m, 5m, 1D, etc.
- Directly place orders from the Technicals section. These orders will be executed exactly like any other order through your stockbroker and will reflect in your broker app as well as in Streak Orderbook and Positions.
- Create your watchlist, add multiple stocks to it and customize, rename or edit it as per your preference.
Scanners
You have trading ideas. But how do you find the relevant stocks from the list of hundreds of stocks listed on NSE?
Enter Scanners! This is a section on the Streak platform that helps you filter stocks based on certain conditions. Scanners are used to identify the stocks in play. You need to set up a few conditions and strategies and voila, you have a list of stocks that are doing the exact same thing you mentioned in the conditions.
A few examples of Scanners can be useful:
- If you want to know the list of NIFTY100 stocks that gained 2 percent in the last 1 hour.
- If you want to search stocks within different sectors such as NIFTY50, NIFTY100, BANKNIFTY, etc
- If you want to know the Top Gainers, Top Losers, Stocks with Bullish trend, those with Bearish trend, and a whole bunch of other conditions
You can also choose from a wide range of more than 150 pre-defined scanners, each scanner satisfying a certain set of conditions. You can toggle between your personal scanners and the predefined scanners through the dashboard and you can also keep an eye on the live scanners. There is a ‘star’ provided beside the name of every scanner so that you can mark your favorite scanners.
Hence, at its core, scanners are a fast and quick way to filter out the best stocks that fit your requirements.
Strategies
This is where all the magic happens. This is where you brew your very own ideas and experiences into strategies. Once you are familiar with Technical Analysis, Scanners and you’ve created your own basket of stocks, you can try to finally create your very own strategy.
The discover strategy section has a huge list of pre-created strategies that Streak offers for educational purposes. It has several categories that you can choose from. You can click on any strategy to get a quick glimpse of the strategy conditions, its backtest results, P&L chart, and much more. You may also choose to use these examples to copy and deploy these strategies as your own.
Our strategy builder has been completely transformed in V4; not only in terms of simplicity but also the technical complexity and functionality. You can start by giving your strategy a personal touch by naming it. The next steps are divided into 4 simple parts:
- Add your stocks, enter quantity, select chart type, time frame, and holding type
- Put your entry and exit signals
- Entering Stop-Loss and Target-Profit (this continues to be mandatory in order to protect your downside).
- Review your entire strategy and Run Backtest
The entry and exit conditions are based on a set of indicators and comparators. We’ve also kept in mind to provide a fulfilling experience to all our users! Depending on where you are in your trading journey, you can choose between Basic and Advanced modes:
The Basic mode lets you create strategies in a pre-defined format: first, you need to add the indicator followed by a comparator and then the indicator again. Yes, it’s a simple yet powerful arsenal to pack. We continue to have the “Assist” feature. If you toggle it on, then even a newbie who’s just entered the world of technical analysis can create strategies. Just enter your indicator, and watch as the rest of the strategy gets auto-completed.
The Advanced mode is for users who want the freedom to create absolutely anything they can fathom in an extremely flexible way! Whether you want to use a complex mathematical operator or just start the strategy with parentheses or create multi-layered complex nested conditions for entry and exit – this is the mode you want to choose. As the name suggests, this mode is for experienced or advanced technical traders who want to deep-dive and test it all out.
Backtest
You know Technical Analysis is used to gauge the market conditions using past historical data. Similarly, Backtest helps you analyze the markets better by running your strategy on historical market data. Streak lets you do really fast backtests in a simulated environment. But WAIT! Why is this so helpful?

First, the P&L data is an important piece of information in understanding what worked in the past and what might possibly work in the future. Second, you can have a closer look at all the entry and exit points and a cumulative insight into the profitability of your strategy. Third, you can test your strategy on multiple stocks and instruments, and Streak will perform backtests on all of them and break down the results in a simple yet beautiful way.
Another important feature over here is that you ‘quick edit’ your strategy and/or add or eliminate stocks to modify your results and test out all the favorable outcomes.
Deploy
After running multiple backtests and shortlisting your favorite strategies, it is time to deploy.
There are 2 ways of Deployment:
1. Take Live
2. Paper Trade
Deploying a strategy in ‘Take Live‘ simply means implementing the strategy in real-time in the stock market. Streak gives you an option to select which stocks you want to deploy, the quantity, and the total number of strategy cycles before confirming the deployment. After deploying, Streak starts tracking the stocks in real-time and notifies you with an order window once your strategy entry conditions are met. You can then place orders with your stockbroker using this window.
Once you place your orders, you can see them on your order book and positions page. They are also shown on the broker platform you are linked to, and you can keep track of your trades going back and forth between your broker and Streak platforms. Also, streak allows you to take various actions from the order book page.
You also get a notification as soon as the exit conditions are met. You can also exit the trade from the notification panel of the ‘deploy’ page itself. You even get notified when the trade has hit Stop-Loss or Target Profit.
Let’s consider a different scenario. You have great ideas about the market, you’ve just run backtests and have seen great results but you’re still skeptical about whether it would work out in the real market. Or maybe you are very risk-averse and want to test everything to the dot! We’ve got you covered with “Paper Trade”. This is an option you can choose by toggling from “Live trade” to “Paper Trade” in the Deploy pop-up. In this mode, not a single rupee from your trading account is touched. This method also comes in handy if you are a beginner and want to learn how to Deploy without putting your capital at risk. Paper trade works exactly like live trade except that all the orders placed are hypothetical and do not hit markets.
Final Thoughts
This brings us up to speed. Hopefully, you have a better understanding of the important features Streak has to offer. But this is not it! Once you start exploring, you will learn about the subtle nitty-gritty in our platform better.
You can download the app here or search for it on the Playstore and Appstore.
Have any questions or concerns? Drop us an email at [email protected].
Enjoy Exploring Streak 😊


