Do you dabble in stock markets every single day? Now of course you’d need some tool to analyze the price movements of the security. Something. Probably anything to guide your trades and save you from the emotional rollercoaster. And along with all the anxiety, while trading, you’ll want to know what drives the thinking of your fellow market participants. This is exactly where Technical Indicators come to the rescue. And no kidding, if you’re a beginner, they can prove to be very useful.
Let’s deep dive into the huge world of indicators!
What is Indicator-Based Trading? How Does it Work?
To define it in the most simple terms, indicator-based trading is a method of trading using technical analysis indicators. These indicators are often built on a preset logic or a set of mathematical formulas using the price, volume, or open interest of a stock.
Most traders find this an important ‘add-on’ to their technical study (candlesticks, volumes, S&R) to arrive at a trading decision. These indicators can help you with the timing of trades and alert you about specific trends. They also focus on evaluating a stock’s strengths or weaknesses. You can predict what the market will do and where it will go with precision – if you learn to use the indicators effectively.
Phew, talk about making life easy! I wouldn’t exactly say that because there’s so much more to more to indicators than meets the eyes. But knowing how these indicators work can provide an added dogma and discipline to your trading style.
Now, technical Indicators provide a perfect visual representation of the mathematical formulas used to form them. They consider a huge chunk of historical information, crunch that information, and help predict the price movements. They are designed to analyze short-term trends and hence it serves a great purpose to Day Traders or more active traders. But you don’t underestimate its power to identify entry and exit points for medium and long-term trades, too.
Technical indicators can also be incorporated perfectly into Automated Trading Strategies due to their quantitative nature.
Types of Indicators
There are a variety of indicators. Your first thought might be, which are the best ones!! Although there are a few really popular indicators. You can also say that few of them are the bread and butter of so many traders out there. But they did not simply google ‘the best technical indicators’ and possibly find a Holy Grail at some point. It takes time to understand an indicator and see if it’s best suited for your trading style, does it complement well with other indicators to give strong signals, is the backtest results giving good profits, yadda, yadda, yadda, more on this later. Right now, let’s discuss the major types of indicators and the exact indicators that fall into these categories:
- Leading Indicators: As the name suggests, these indicators lead the price. They give trade signals when the trend is about to start. It might signal the occurrence of a new trend in advance. You might be excited right now? An indicator that predicts the future? Let’s make one thing very clear – these indicators are notorious for giving false signals. Hence, traders need to extra careful. To support the trend, you can always use it with the combination of a lagging indicator.
Oscillators: A majority of leading indicators are called oscillators as they oscillate between a local minimum & maximum. They are usually plotted above or below a price chart. Typically an oscillator oscillates between two extreme values, for example, 0 to 100. The interpretation varies based on the position of the oscillator on the chart. The most common examples are – Stochastic Oscillator, MACD, or RSI.
- Lagging indicators: A lagging indicator lags the price. They closely follow the price action signal the occurrence of a reversal or a new trend ‘after’ it has occurred. But then why use these indicators? They’re typically easy to identify, measure and compare against previous trends, which makes lagging indicators very useful.
Overlays: A majority of leading indicators are called overlays as they use the same scale as prices and are plotted over the top of the prices on a stock chart. Examples include Moving Averages and Bollinger Bands. In fact, Moving Averages are such a giant topic to talk about. So many important indicators out there are formed based on Moving Averages.
Now that we are done with the broad classification, let’s get into specific details. Indicators from Leading and Lagging categories may belong to one of the following categories:
- Trend Indicators: They measure the direction & strength of a trend. The formula is such that it keeps a specific type of price averaging as the baseline. As price moves above the average, it can be thought of as a Bullish trend. If it moves below the average, it signals a Bearish trend. Examples:
- Moving Average / MA (type: lagging) – Used to identify current trends and trend reversals. Moving Averages as also used to set up Support and Resistance levels.
- Moving Average Convergence Divergence / MACD – (type: lagging) – Used to reveal changes in strength, momentum, and duration of a trend in a stock price.
- Parabolic Stop and Reverse / SAR – (type: leading) – Used to find potential reversals in the market price direction.
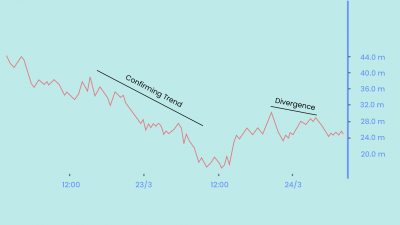
- Momentum Indicators: Before talking about this indicator, let’s discuss what exactly is momentum. As in Varsity, it is defined as the ‘quantity of motion a stock has.’ Momentum is a term used in Physics and shouldn’t be confused with the speed at which the markets move (although it’s partly true). Now momentum indicators will help identify the rate of change in price movements by comparing prices over some time. To understand the formula a little – it is calculated by comparing the current closing price to the previous closing price. Typically this is represented as a line below the price chart. A Divergence between the price and a momentum indicator can signal a change in future prices. Examples:
- Relative Strength Index / RSI (type: leading) – Measures the stock’s recent trading strength, the velocity of a change in the trend, and the magnitude of the move.
- Stochastic Oscillator (type: leading) – Used to predict price points by comparing the closing price to its price range.
- Commodity Channel Index / CCI (type: leading) – An oscillator used to identify price reversals, price extremes, and trend strength.
- Volatility Indicators: These measure the rate of price movement, regardless of direction. This is generally based on a change in the highest and lowest historical places. They provide useful information about the range of buying and selling that takes place in the stock market. This will help you to determine points where the market may change direction. Examples:
- Bollinger Bands (type: lagging) – Used to measure highness or lowness of the price, relative to previous trades.
- Average True Range / ATR (type: lagging) – Used to know the degree of price volatility.
- Volume Indicators: They use some form of volume average and smoothening to determine the strength of a trend or confirm a trading direction. You might have seen instances where the trend suddenly becomes strong. It is usually the increase in trading volume that can lead to large movements in price. Examples:
- Volume Weighted Average Price / VWAP (type: lagging) – It is the average price the stock has been traded at in an entire day, taking into consideration both volume and price.
- On-Balance Volume / OBV (type: leading) – It attempts to measure the level of accumulation or distribution by comparing volume to price movements.
Which Indicator is the Right One For You?
At the core, the mathematical calculations of each indicator displays the price movement of assets in its unique way. Several settings can be configured to modify the way the indicators are displayed. Now, these data points are typically derived from a chart’s price bars, which are composed of an open, a high, a low, and a close (commonly referred to as OHLC).
You should take out enough time to test out every indicator. The times it gives a correct signal, the times it gives a false signal. Experiment with different settings for any indicator that you use. Select the settings that work best for your analysis and trading style. To experiment with input data, you can place several versions of the same indicator on the same chart. Change the input data for each one to visually see how the input data cause the indicators to show different signals. Change the color of various indicators can help you tell them apart. Finally, you should run backtests, gauge your profits and determine if the indicator matches your trading style.
Which Price to Take into Consideration – The OHLC and HLC Averages:
The average of the open, high, low, and close (OHLC) for a given time frame is the average value of – the opening price, the highest price that was reached, the lowest price that was reached, and the closing price. For example, a candlestick or price bar may have an open of 70, a high of 90, a low of 60, and a close of 75.
The calculation of the open, high, low, close average is calculated as follows: OHLC Average = (70 + 90 + 60 + 76) / 4 = 74
The HLC Average is much the same except the open price is excluded, and the sum of the high, low, and close are divided by three: HLC Average = (90 + 60 + 76) / 3 = 73.33
Though the resulting averages are comparable, this shows how changing the parameters of the data being input affects the calculation of the indicator.
Usually, the closing price is taken into consideration. But there might arise situations where using the open, high, low, or an average would prove to be beneficial.
Indicator-Based Trading Strategies:
The world of indicators is huge, it is easy to get lost in it. Soon, you’ll find yourself confused and trying to find some sort of stability. There are hundreds of indicators and new ones are being created all the time. By combining these indicators and using indicators in different ways, you can form countless strategies. There are many popular textbook strategies out there. And though they are popular and well known, you might not be able to book a profit.
There are a few very common types of Indicator Strategies. Let’s have a look at them:
- Crossover Strategy: Take two lines – one formed by the indictor and another formed by the price or yet another indicator – and put it on the chart. Voila! There you have the most common and straightforward strategies to gauge entry and exit points. Few things you need to keep in mind are that one of the indicators should evaluate the long-term price movements while the other should follow the short-term price trends. When one line crosses above or below the other, it resembles a possible Bullish or Bearish trend. In turn, it gives a basic idea of if you can buy or sell the stock at that point.
- Uptrends and Downtrends: Many indicators also act as a confirmation tool. If you see an uptrend on the price chart, indicators such as the RSI, MACD, or moving averages (as well as many other indicators) help provide support to the Momentum of the trend.
Advantages of Indicator Based Trading
By now you’d have known that indicators help greatly in simplifying price movements. If you are a beginner, you may find these movements of indicators easier to interpret compared to the complexities of a price chart. Now, “easier doesn’t mean more profitable.” Indicators are just a great way to spot the momentum or spot ongoing trends and trend reversals (that too with some delay or lag). As a new trader, you might not know how to assess the price charts. But with the aid of these indicators, you can identify those subtle changes which are easy to miss out on, book your profits, and exit for the day. And as time passes, you can train yourself to identify the signals better.
Limitations of Indicator Based Trading
Talking about limitations, the indicators often won’t reveal anything more than what is visible to, maybe, a pro (who isn’t using indicators). This is true because they only provide information based on price and volume. They won’t ever show anything different other than what the price and volume on a chart have to tell them. And that is why most of them lag.
The most important thing to note is that while they appear easy on the surface, you might have ‘zero clue’ as to what’s under the hood. What are the calculations used by an indicator to arrive at certain numbers? You might see most bloggers and YouTubers telling you not to bore yourself with those math formulas. But again, if you decide to look at the complex formulas, you might end up banging your head on the wall. That’s the reason so many traders fall for false signals. And no kidding, indicators do provide a lot of them. So, always, always, always use multiple indicators to confirm a trend. Have your risk management in place and avoid overtrading if you’re failing. Research and knowledge is the key.
Bottom line, don’t just look at the times the indicator told you to do something and you won or lost. Also, look at times the indicator failed to warn you about getting into a trade or getting out of one.
Happy Trading! 😄


