Introduction to hammer candlestick pattern
A hammer candlestick is a type of candlestick pattern that is used to signal a bullish reversal in the market. It is so named because it looks like a hammer, with a long lower shadow and a small body at the top. The long lower shadow indicates that the market was testing lower prices but ultimately reversed and closed higher.
What is a hammer candlestick?
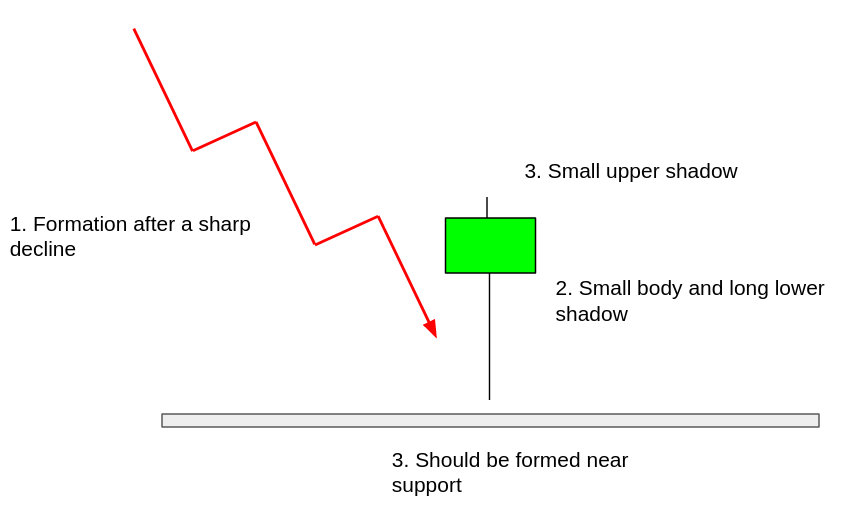
The hammer candlestick pattern is a bullish reversal pattern that can be found at the bottom of a downtrend. The pattern is made up of a single candlestick with a small body and a long lower shadow. The long lower shadow indicates that the bears were able to push prices down significantly from their opening level but the bulls were able to retake control by the close and push prices back up.
While the candlestick itself is not overly bullish, it does show that the bulls are starting to gain some momentum and could take control of the trend in the near future. The key to trading the hammer pattern is to identify where it is formed and wait for confirmation with the next candlestick. A bullish candlestick following the hammer can confirm the reversal and provide a good entry point for a long trade.
How to identify a hammer candlestick pattern?
There are a few things to look for when trying to identify a hammer candlestick pattern. The first is that the pattern should form after a period of decline. The second is that the candlestick should have a small body with a long lower shadow. The lower shadow should be at least two to three times of the body. The body should be in the upper end of the trading range. The third is that the upper shadow should be relatively short.
If you see a candlestick that meets these criteria, then it is likely a hammer. You will not need to look for a hammer pattern manually. Using the Streak platform, we will create a scanner to identify stocks forming the hammer pattern. This pattern is a bullish reversal signal. The pattern has a higher probability of success if it is formed right above a support level after a sharp decline in prices. The color of the candlestick can be either red or green but green hammer patterns are more bullish than the red ones.
Scanning for hammer candlestick pattern
This scanner will scan for stocks forming the hammer pattern on the previous candle (i.e the candle which is completely formed. It will exclude the current or the last candle). To scan on the current or the latest candle, all the -1s should be changed to 0s. The scanner will scan for both, red as well as green patterns. To scan for only greens, all the conditions after ‘OR’ should be removed. Similarly, to scan for only reds, the conditions before ‘OR’ should be removed.
You may choose the timeframe as per your preference. You can also take the scanner live to get live alerts whenever stocks form the pattern by clicking on the take live option in the menu button below the ‘Scan Now’ button. For any assistance, you can contact us at [email protected].
Link to the scanner: https://public.streak.tech/in/2j4YA9619T
Strategy Example:
Now we are going to put our knowledge to play. We will be creating a hammer candlestick pattern strategy and backtesting it. The strategy takes a buy position when the previous candle forms a green bullish engulfing pattern just above the S1 pivot level which acts as a support and then current candle closes above the high of the previous candle. as the stock usually reaches the S1 pivot level only after a decline, a separate condition for sharp decline has not been included . The exit is based on percentage based fixed stoploss and target.
Strategy Link: https://public.streak.tech/in/PInh2elIUt
Conclusion:
The hammer candlestick is a bullish reversal pattern that can be found at the bottom of a downtrend. The key to trading the hammer pattern is to identify where it is formed and wait for confirmation with the next candlestick. A hammer candlestick pattern is a bullish reversal signal. If the pattern is formed right above a support level, it has a higher probability of success. Using the Streak platform, we can create scanners and strategies to identify and trade the happier pattern.
Disclaimer: The information provided is solely for educational purposes and does not constitute a recommendation to buy, sell, or otherwise deal in investments.


