Introduction:
Candlestick patterns have always been very popular among traders for decades. They prove to be very useful while analyzing price action at important levels. They also help one understand market psychology. In this post, we will particularly discuss the Three Inside Up pattern.
Identifying the Three Inside Up Pattern:

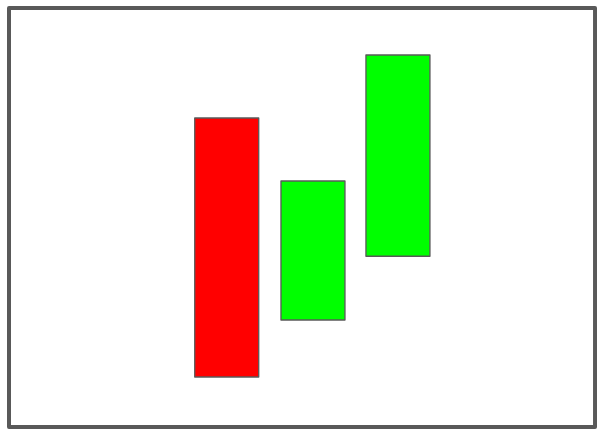
The pattern is a combination of three candlesticks arranged in a particular sequence. It is a reversal pattern and hence it is meaningful only at the end of the downtrend. It signifies that the downward momentum has slowed, volatility has contracted and then expanded in the opposite direction. The pattern can be used near support levels or after a pullback to enter the trade with a stop loss below the pattern. The important characteristics of the pattern are as follows :
- The first candle is a bearish candle. It shows a continuation of the prior downtrend.
- The second candle is a small green candle whose body lies completely within the body of the previous candle. This signifies a momentum reversal and contraction of volatility (since it is a small inside candle).
- The third candle is a bullish candle and closes above the 1st candles high. This signifies that the bulls have taken control and overpowered the strength of the downtrend.
Interpreting the pattern:
The first large bearish candle signifies a continuation of the downtrend and a large sell-off. This sends a signal that the bears have a tight grip in the market, discouraging the buyers. The second candle opens within the body of the first candle. Rather than following through the bearish trend, it closes in green and above the close of the first candle. This cautions the short term sellers and some might even close their positions. The third candle establishes complete bullishness.
New buyers with a risk appetite see this as a reversal sign and an opportunity to enter the trade. At this point, many short-sellers are trapped and in a hurry to exit their position. This can trigger a series of stop losses placed by the short-sellers which acts as a fuel in propelling the prices higher.
Like the three inside up pattern, there also exists a bearish reversal pattern — The inside down pattern. The pattern and its interpretations are exactly the opposite of the inside up pattern that we have discussed.
Back-testing the Three Inside Up Strategy:

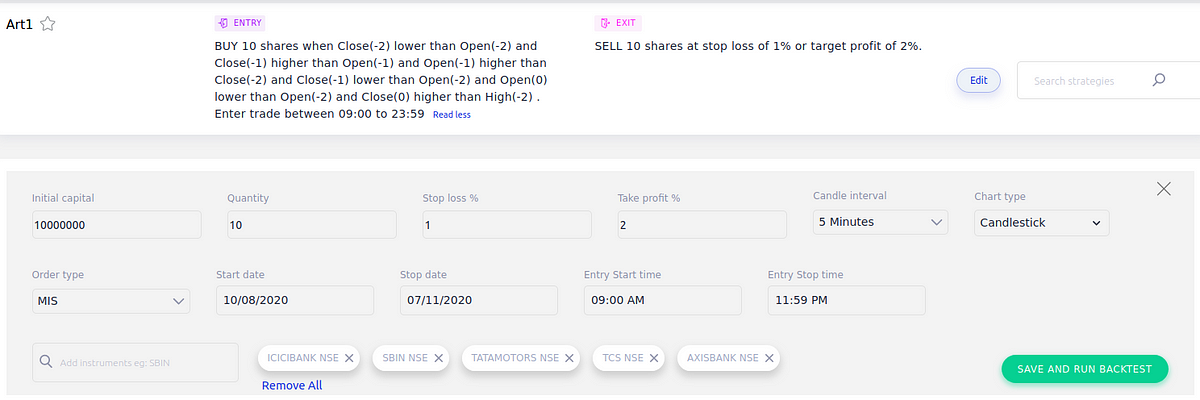
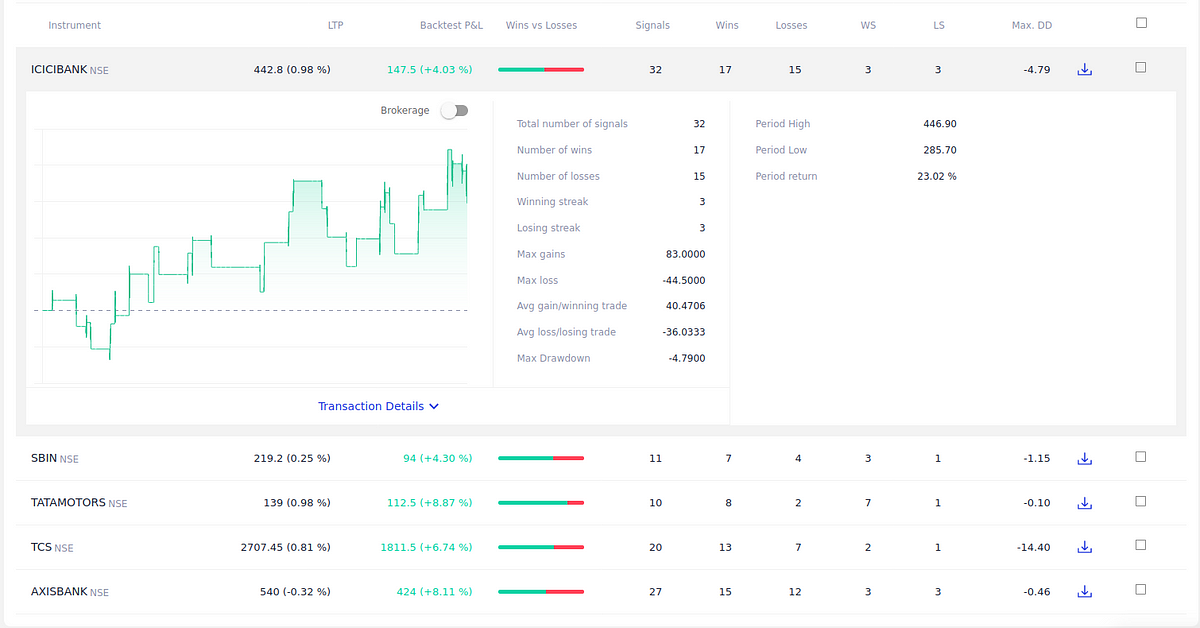
Though candlestick patterns should not be used anywhere but only near important levels. For demonstrating the backtest and for the purpose of simplicity, we will backtest the pattern alone. The backtest results :

The strategy was not successful on all the stocks but as we can see in the image above, for many of the popular stocks, the strategy has shown promising results with decent returns and low drawdowns. This is a long-only strategy and has been backtested over the period of the last 3 months on a 5 min time-frame.
Conclusion:
Three Inside Up pattern is a complex pattern consisting of three candles hence it does not appear very frequently in the markets. But as with other patterns of low frequency, it has good predictability when it is formed at important levels. The pattern is easy to identify on the charts and helps explain the psychology of market participants at key reversal points. Successful strategies can be developed by combining the pattern with other indicators along with a good risk management strategy.
Disclaimer: All the information provided is only for educational purposes and should not be construed as investment advice.


