Why Learn about Reversal Patterns?
Reversal patterns are the earliest warning sign when the trend is about to change or reverse. Due to this, it can help in entering the trade early when the new trend is forming. If you are already in a trade, these patterns can provide you early warning of reversals. Most of these patterns are easy to identify.
What is reversal ?
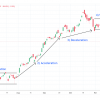
A reversal occurs when the price of an asset reverses direction. Reversal means that the price has changed its course from going up to going down, or from going down to going up. If the stock keeps moving in the direction of reversal, it forms a new trend.
Types of Reversal Patterns
Things to remember
Traders should look for reversal patterns only after a strong trend. Reversal patterns formed near support and resistance levels have higher probability of success. Reversal chart patterns exhibit longer term reversal as compared to candlestick patterns. Bullish reversal chart patterns correspond to accumulation phase while bearish reversal patterns correspond to distribution phase.
Bearish Reversal Candlestick Pattern Example
Dark Cloud Cover
Characteristics:
Day 1 closes on a bullish note. Day two opens gap up but closing happens at least half way down the previous day’s candle.
Market Behavior:
The market climbs upward on the first day of the dark cloud cover pattern, forming a green bullish candle. The price opens the next day above the previous day’s closing price, seeking to set a new high (expecting the bullish trend to continue). The bears have a quick selling interest at the high point of the day, driving the prices lower. Bulls are not able to lift the price and close happens lower than the half body of the 1st candle.
Scanner Example 1
The below conditions allow you to scan for stocks where the dark cloud cover pattern is forming on the current candle.
Strategy Example 1
The strategy is based on a dark cloud cover pattern. Since it’s a bearish reversal pattern, the strategy is a short sell strategy. The conditions are same as that of the conditions of the scanner that we saw in the previous section, except for the last condition which has been newly introduced in the strategy. The last condition simply says that the pattern should not have formed below the 20 period low. As this is a bearish reversal pattern, it should not have formed after a bearish trend.
Conditions:
Parameters:
Backtest Results:
Bullish Reversal Chart Pattern Example
Double Bottom
The pattern resembles ‘W’ shape with resistance in the middle and support on either side. Both the supports should roughly be on the same level. It is a bullish reversal pattern. One way to enter a new trade using this pattern is to wait for the resistance to be cleared by the price after the formation of the second bottom.
Scanner Example 2
This scanner will allow you to scan for stocks that formed a double bottom and now the price is above the resistance line.
Strategy Example 2
The strategy is based on the same conditions as explained above for the scanner.
Conditions:
Parameters:
Backtest Results:
Conclusion:
Knowing about trend reversals can allow us to Enter new trades and Exit older trades quickly. It shows that the price direction of an asset has changed, from going up to going down, or from going down to going up. Early warning signs should be confirmed by using confirmation methods. Patterns as well as indicators can be used to identify and trade reversals. Scanners and Strategies should be developed to take advantage of such moves.
Disclaimer: The information provided is solely for educational purposes and does not constitute a recommendation to buy, sell, or otherwise deal in investments.


