You can quickly and easily visualize price activity and volatility using bands and channels. They also make it simple to spot price extremes. bands and channels can also be used by breakout traders. These indicators adjust to the most current changes in price. In this post, we’ll discover four such indications and use them to build strategies and scanners.
1. Donchian Channel

Upper channel line is the highest price in the last 20 candles and the lower channel line is the lowest price in the last 20 candles. Middle line is the average of the upper and lower channel lines.
For trend trading, the crossover of price with the middle line can be traded.
Bullish Trend Identification: Price above the middle band and the upper band is Rising
Bearish Trend Identification: Price below the middle band and the lower band is falling.
2. Fractal Chaos Bands

Fractal chaos band plots the pivot highs and pivot lows. Pivot high candle is the candle that has a high which is higher than the high of the candles to its right and left as shown in the illustration on the top right corner in the above image. The candle with a pivot low is one whose low is lower than the lows of the neighboring candles on the left and right.
When the slope of the indicator is up, the market is bullish and when the slope is down, the market is bearish. The indicator can be used to identify trends and for trading breakouts as the pivot high’s and lows act as support and resistance.
3. Bollinger Bands

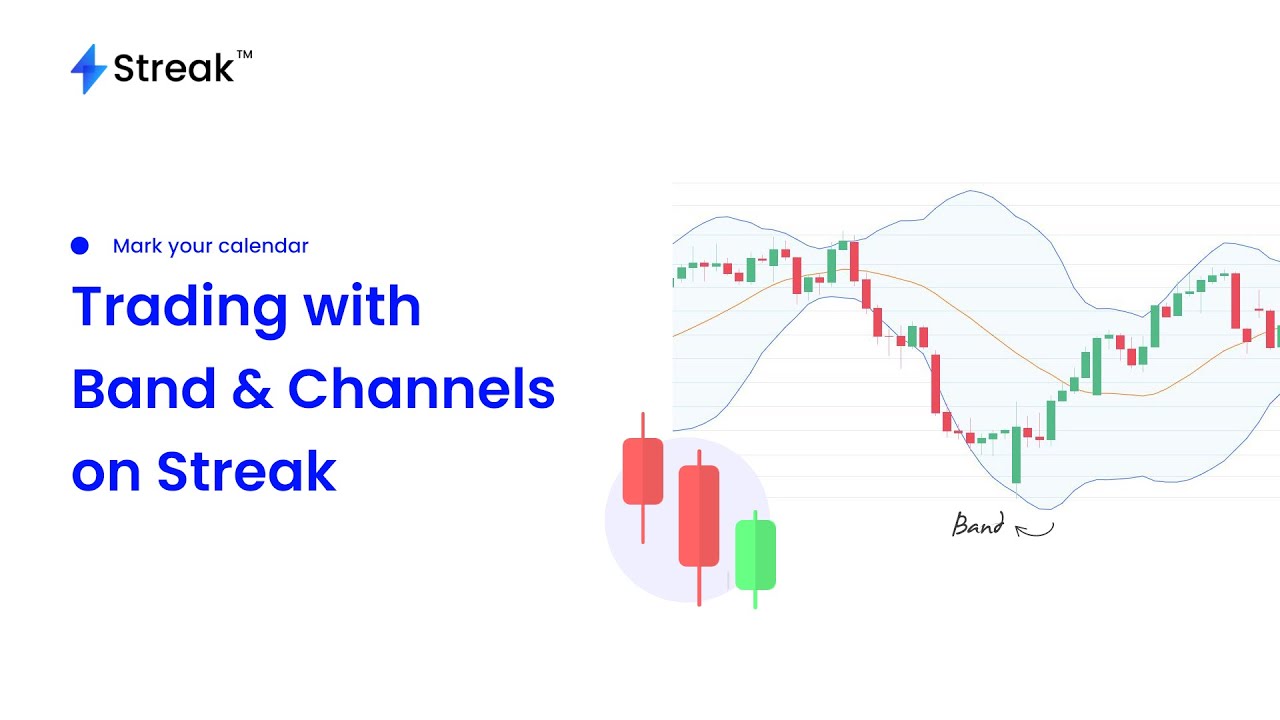
Bollinger bands moving closer indicates decreasing volatility and bands moving apart indicates increasing volatility. When the bands tighten during a period of low volatility, it raises the likelihood of a sharp price move in either direction. This is because volatility is cyclical.
Prices have a tendency to bounce within the bands’ envelope, touching one band then moving to the other band. This can help determine overbought and oversold levels during sideways market.
A strong trend continuation can be expected when the price moves out of the bands. However, if prices move immediately back inside the band, then the suggested strength is negated.
4. Keltner Channel

The middle line in the indicator is an EMA. The upper and lower channel lines are created by adding and subtracting ATR with a multiplier. The most commonly used settings are 2 x ATR (10) for the upper and lower lines and EMA (20) for the middle line. Tightening indicates decreasing volatility and expanding bands indicates increasing volatility. The angle of the Keltner Channel also aids in identifying the trend direction.
Strategy Example 1:

Strategy Link: bit.ly/DonchianStrategy
Strategy Example 2:

Strategy Link: bit.ly/BollingerBandsS1
Scanner Example 1

Scanner Link: bit.ly/FCBreakout
Scanner Example 2

Scanner Link: bit.ly/KChannel1
Conclusion:
Bands make it easy to visualize breakout levels, volatility and trend. Bands adjust to the recent price movement. Different types of bands are available for different purposes. They can easily be used on streak to create, backtest and optimize trading strategies.
Disclaimer: The information provided is solely for educational purposes and does not constitute a recommendation to buy, sell, or otherwise deal in investments.


