TRIX Momentum Oscillator displays the percent rate of change of a Triple Exponentially Smoothed Moving Average – we just can’t seem to get rid of moving averages in Indicators. They are the most fundamental of all the indicators. Read about Moving Averages in detail, if you haven’t.
Jack Hutson introduced TRIX to the world of trading. Just like a moving average, TRIX filters out the noise and insignificant price movements in its own way.
Let’s quickly look at the math behind TRIX:
Step 1: Find the single smoothed EMA= 15-period EMA of the closing price
Step 2: Find the double smoothed EMA = 15-period EMA of Single-Smoothed EMA
Step 3: Find the triple smoothed EMA = 15-period EMA of Double-Smoothed EMA
Step 4: TRIX = 1-period percent change in Triple-Smoothed EMA
Interpretation
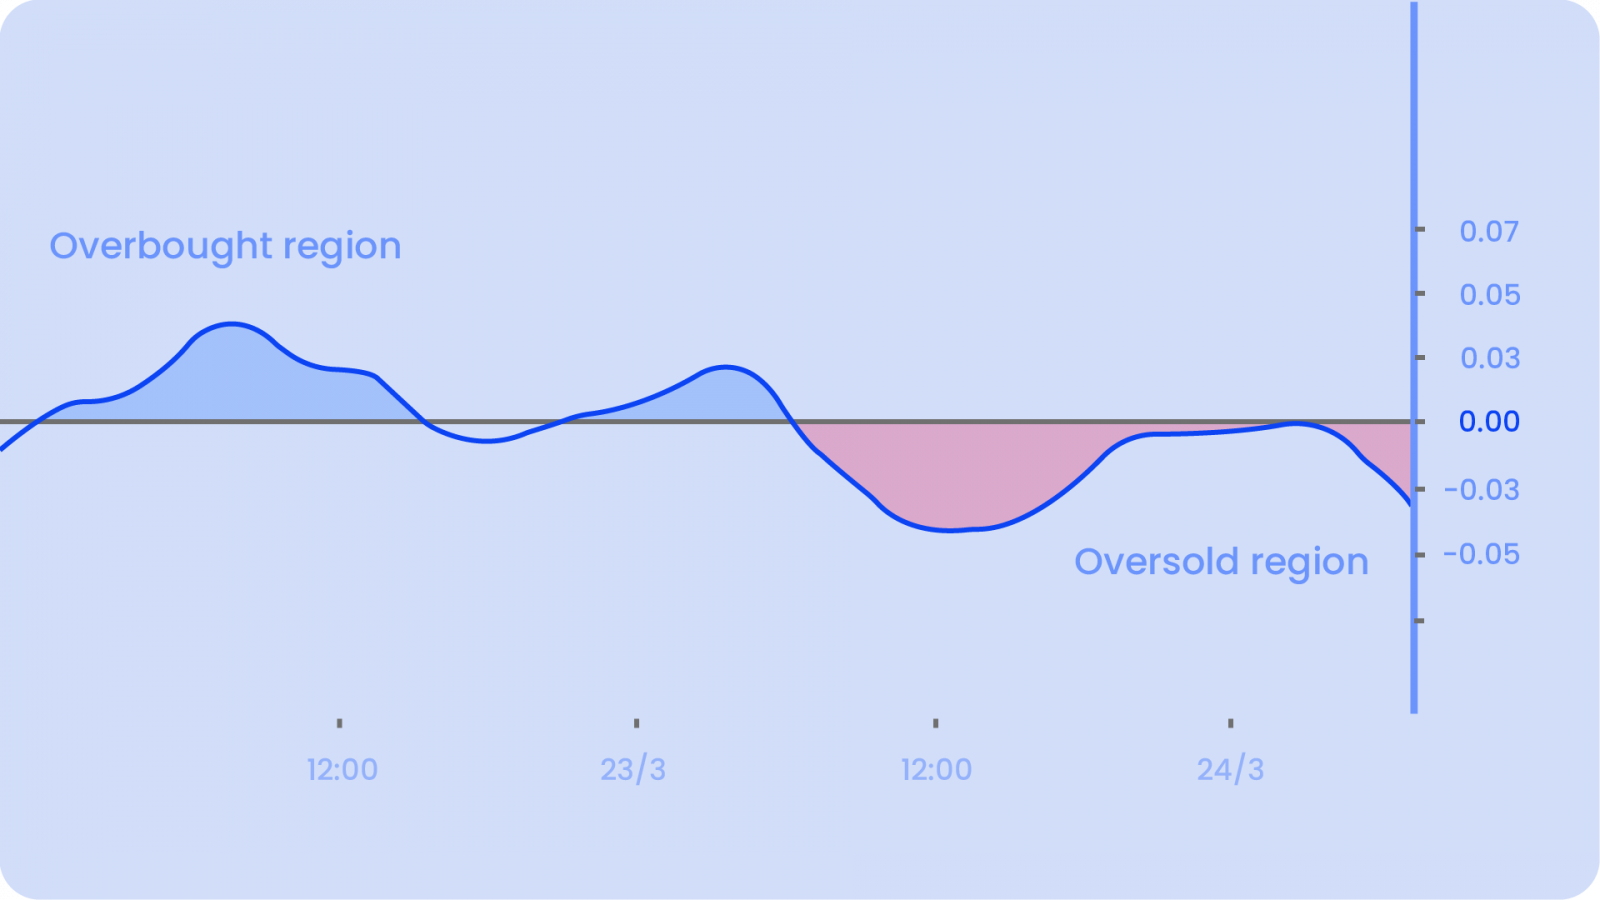
TRIX helps us identify the Oversold and Overbought market conditions. It is a powerful oscillator and moves around a ‘zero’ line. When it is above the zero line, it means the market is overbought and when it is below the zero line, it means the market is oversold. TRIX (15,9) is quite similar to MACD (12,26,9). Both are momentum oscillators that fluctuate above and below the zero line. Both have signal lines based on a 9-day EMA. Most notably, both lines have similar shapes, signal line crossovers, and centerline crosses. The biggest difference between TRIX and MACD is that TRIX is the smoother of the two; TRIX lines are less jagged and tend to turn a bit later.
Buy Signal: When TRIX crosses above the Zero Line
Sell Signal: When TRIX crosses below the Zero Line
Think of the Zero Line as the 50-yard line of the football court. The offense has the edge after crossing the 50 (midpoint), while the defense has the edge as long as the ball remains beyond the 50. As with signal line crossovers, these centerline crossovers produce both good signals and bad signals. The key, as always, is to minimize losses on the bad signals and maximize gains with the good signals. For this, we need to combine the signal given by TRIX with signals of complementary indicators. We can also use Support and Resistance lines and wait for a subsequent Support or Resistance breakout.
It should be noted that zero-line crossovers can last a few days or a few weeks, depending on the strength of the move. Due diligence is required before relying on these frequent signals. Volatility in the market and stocks can also increase the number of crossovers.
The major advantage of TRIX filtering out the market noise gives it the tendency to be leading in nature (rather than lagging). It measures the difference between each bar’s “smoothed” version of the price information. If you’re comfortable using TRIX, you may find yourself avoiding the short-term market cycles and temporary shifts in market direction.
We also need to keep one thing in mind about any moving average-related indicators: the shorter the time frame, the more accurate the indicator will signal the price move. Just like using two different moving averages (a crossover) for identifying entry and exit signals, using two different periods for TRIX might prove to be very helpful, too.
Divergences
Divergences occur when the price movement and the indicator do NOT confirm with one another. In every scenario, there are two types of divergences:
A Bullish Divergence forms when the stock makes a lower low, but the indicator forms a higher low. This higher low shows less downside momentum that may foreshadow a bullish reversal. This situation doesn’t work well with strong downtrends. The price seems to be gaining momentum as the indicator produces higher lows. But the momentum still has a bearish bias as long a the TRIX is below the centerline. The fall is just ‘not as fast as before.’
A Bearish Divergence forms when the stock makes a higher low, but the indicator forms a lower high. This lower high shows waning upside momentum that can sometimes foreshadow a bearish reversal. This situation doesn’t work well with strong uptrends. The price seems to be losing momentum as the indicator produces lower highs. But the momentum still has a bullish bias as long a the TRIX is above the centerline. The rise is just ‘not as fast as before.’
Therefore, you need to keep these divergences in mind and really confirm the direction of the trend before entering or exiting a trade. You should use it in tandem with other aspects of technical analysis, such as chart patterns.
A combination of trend and momentum. TRIX definitely has a lot to offer to anyone using it.
Happy Trading 😊


