Volume plays an important role in technical analysis since it helps in understanding the demand and supply of an asset. In this article, we are going to discuss a technical indicator that not only considers price movement but it also includes volume as well in its calculation – Chaikin Money Flow.
What is Chaikin Money Flow (CMF)
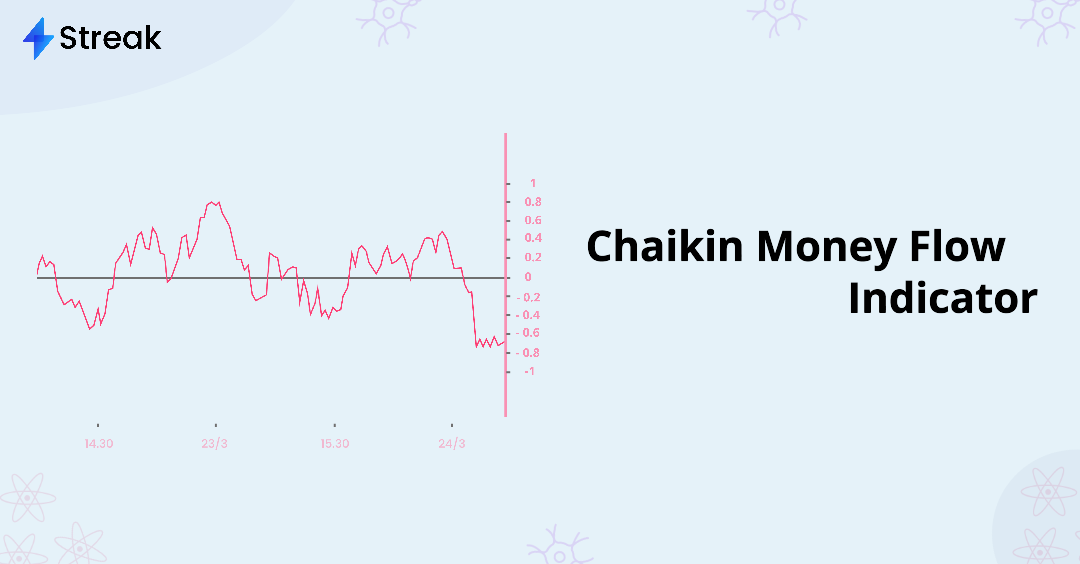
Developed by Marc Chaikin, Chaikin Money Flow is a momentum oscillator that helps in assessing the flow of money into or out of an asset. It is based on the idea that price and volume are two essential factors in determining the strength and sustainability of a trend. The indicator value can vary between -1 and 1, with positive values indicating bullish money flow (buying pressure) and negative values indicating bearish money flow (selling pressure).
Formula:
Here is the formula for calculating the Chaikin Money Flow indicator:
Money Flow Multiplier = [(Close – Low) – (High – Close)] /(High – Low)
Money Flow Volume = Money Flow Multiplier x Volume
Chaikin Money Flow = Sum( 20, Money Flow Volume) / Sum( 20, Volume)
High Low Close and Volume is of the current candle
Sum( 20, Money Flow Volume) = Total sum of last 20 candle Money Flow Volume
Sum( 20, Volume) = Total sum of last 20 candle Volume
When a candle closes near its High, the Money Flow multiplier becomes positive and when the candle closes near its low, Money Flow multiplier becomes negative. Therefore for a Green candle there is a high probability of the multiplier being positive and vice versa. When Close = High, the multipleir becomes 1 and -1 when the Close=Low.
Only one parameter is required. The default value is 20.

Interpretation:
Chaikin Money Flow fluctuates between -1 and 1. The indicator value usually stays between -0.50 and +0.50 and it would take a very strong trend i.e 20 consecutive Close=High for the 20-day CMF to reach +1. Similarly 20 consecutive Close=Low would generate a CMF value of -1.

The 0 line is the centerline of the Chaikin Money Flow indicator. When the indicator is above the 0 line, it means that there is more buying pressure than selling pressure. When the indicator is below the 0 line, it means that there is more selling pressure than buying pressure.

The CMF is a lagging indicator and this can also be observed in the above chart. A number of Green candles with Close near High has to form before the CMF turns positive. Similar case would be for a negative CMF value.
Since it uses OHLC values of the current candle, it does not consider the effect of gaps and can generate false signals during gap ups and gap downs.
Also the indicator uses Volume in its calculation and hence it cannot be used on indices like NIFTY and BANKNIFTY. An index cannot be traded directly, you can only bet on an index using F&O instruments or by directly trading its constituents.
How to use the Chaikin Money Flow Indicator
Chaikin Money Flow can be used for:
Trend Confirmation: When the CMF value is consistently above 0, it indicates a bullish trend. When the CMF is consistently below 0, it indicates a bearish trend.
Trend Reversal Identification: It can also help in identifying potential trend reversals – when the CMF value crosses above or below the zero line. When the CMF crosses above 0, it indicates that the buying pressure is increasing and that the trend may be reversing to the upside. Similarly when the CMF crosses below 0, it indicates that the trend may become bearish.
Divergence Identification: Divergence occurs when the CMF and price moves in opposite directions. This can be a signal that a trend is about to reverse.
For example, if a stock is making lower lows, but the CMF is making higher lows, it could signal a bullish divergence, indicating that the downtrend may be weakening.
Sample Strategy:
Let us now create a Long strategy in Streak using the concepts discussed above.
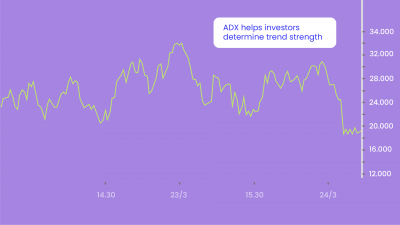
Entry: I will enter a long position when the Chaikin Money Flow indicator crosses above 0 and the Plus DI(+DI) higher than the Maximum of ADX and Minus DI(-DI). Here is a snapshot of the conditions:

Exit: I will Exit my position at a Stop Loss of 3% and 30%.

Here are the backtest results on a few random stocks:
You can access the backtest result, copy the strategy, and modify the logic on any stock of your choice.
Conclusion:
Although, CMF uses both price and volume in its calculation, it has several flaws. It is a lagging indicator and does not perform well in a rangebound market. It cannot be used with any index because indices do not have any volume. Also it may generate false signals in illiquid markets and during gap up/down. The Chaikin Money Flow should be used with be used a trend-following or price based oscillator that uses True Range or Average True Range in its calculation to counter these flaws. As always, do not put your money just on the basis of any indicator, strategy or tips, please backtest your strategies thoroughly before using them in the live market.
Disclaimer: The information provided is solely for educational purposes and does not constitute a recommendation to buy, sell, or otherwise deal in investments.


