We all know that “The trend is your friend (until the end when it bends)”. Moving Averages are great indicators to gauge trend direction.
While trading in the markets, especially the more trending ones, you must’ve seen the number the times the price moves up and down. The changes in prices are so frequent and the momentum is so high, the charts can easily give a ton of false signals. And during times like these, you can easily make the wrong choices and make losses.
Enter Moving Average! *drumrolls* This indicator helps greatly in reducing the random ups and downs and filtering out the unwanted noise in the price charts. It shows you a clear trend by smoothening out the prices and following the ‘average value moving.’ Basically, you can easily – identify trends, confirm reversals & create lines of support and resistance with the help of Moving Averages. Tada! This seems to solve half your life problems. And it’s right there, a whole variety of moving averages, under the ‘indicators’ tab on your price chart.
Let’s Understand the Math Behind the Simple Moving Average (SMA)
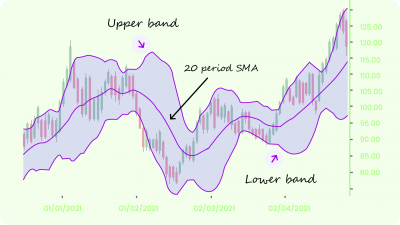
The most basic of all the MAs is the Simple Moving Average. It shows the average price of a stock over the past N days. For example, a 50-day Simple Moving Average is calculated by adding the closing prices of the past 50 days and dividing the sum by 50.
Now, If one wants to know the average of the past 5 days starting on 4th Jan’21 – we take 4th Jan as the last day & 30th Dec’20 as the first to calculate the average. And if we want to find the average on 5th Jan’21 – we start calculating from 31st Dec’20 instead of 30th Dec’20. To find out the average on 6th Jan’21, we start from 1st Jan’21 and so on. Hence, the term is known as a Moving Average. You can see a visual representation of these values as a line on your price chart.
How to Use Moving Averages for Trading
You already know that Moving Averages can your life a tad easier. But before jumping into the applications of Moving Averages, there is one important limitation you need to know. Just like most indicators, MA is based on past prices. Hence, it shows a lag! It doesn’t have the power to warn you in advance. But it will confirm when a trend is ongoing or when a trend change has occurred.
Okay, now that we have the basic stuff out the way, let’s talk about what makes the Moving Averages one of the most popular indicators, how to use it, and how to get the most out of it.
- Identifying trend direction
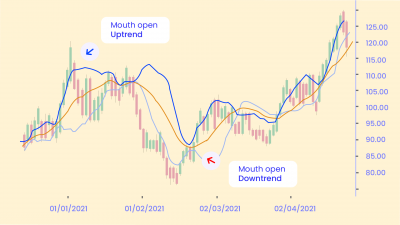
If the MA is moving up, the trend is also up. If the MA is moving down, the trend is also down. And if the MA is somewhat flat, the trend is sideways or choppy. You can also use 3 broad ways to can identify trends using the Moving Averages.
- Long-Term Trend: Usually a 200-day or a 365-day MA is used for the long-term analysis of the trend.
- Mid-Term Trend: Usually a 50-day or a 200-day MA is used for the mid-term analysis of the trend.
- Short-Term Trend: Usually a 7-day or a 50-day MA is used for the short-term analysis of the trend.
The longer the MA period, the more the lag.
Day Traders can use specific candle intervals to gauge the short-term trends. For example, 200-bar MA for long-term trends and 50-bar or 20-bar or 9-bar MA for shorter periods.
- Determining Entry and Exit Signals Using Cross-Over Strategy
While using Moving Averages, one of the strategies you’ll want to look out for is the “cross-over.” This happens when a Moving Average line crosses the price line or yet another Moving Average line. When this crossover happens, be prepared to jump the guns as this could be a possible entry or exit signal. Note that, this might also be a false signal. Hence, using other indicators to support the trend is a great trading strategy.
Examples of a Cross-Over: Now, suppose you plot a 50-day SMA & a 200-day SMA. This will lead to 2 conditions:
- When the short-term trend crosses ‘over’ the long-term trend – when the 50-day SMA crosses above 200-day SMA, you can buy the stock as this might be a possible uptrend. You also assume that a Bullish trend is going to start. This Cross-Over is commonly referred to as the Golden Cross.
- When the short-term trend crosses ‘below’ the long-term trend – when the 50-day SMA crosses below 200-day SMA, you can sell the stock. This is a possible downtrend or Bearish trend. This Cross-Over is also known as the Death Cross.
- Spotting Areas of Support and Resistance
Since the SMA is a smoothed line, it is resistant to the very minor or temporary swings in the price. When the price is moving in the direction of the Moving Average, you can easily check to see if the price will ‘bounce back’ from it or ‘break out’. Usually, during an uptrend, you’ll see that the Moving Average acts as a support. But if the price breaks down, it might indicate a trend reversal. On the other hand, during a downtrend, you’ll see that the moving average acts as a resistance. But if the price crosses the moving average, it might indicate a trend reversal.
Trading Strategy for Simple Moving Average:
- Buy strategy: If the short term trend is bullish, then you can use: SMA(20) higher than SMA(40)
- Sell strategy: If the short term trend is bearish, then you can use: SMA(20) lower than SMA(40)
Now that you have a basic understanding of the Simple Moving Average, you should be able to experiment with it on your price chart. You’ll notice that the indicator gives delayed trading signals. ANd you might find yourself missing out on the ‘highs ’and ‘lows’, especially if you’re a day trader. To solve this problem, we have better, non-laggy forms of moving averages like the Exponential MA, Double Exponential MA, Triple Exponential MA, Weighted MA, Triangular MA, Hull MA, and the Kaufman Adaptive MA. Each of them has a different effect formula, some of them really complex. But don’t worry, let’s simplify the types of Moving Averages for you.
Exponential Moving Average (EMA)
You must be wondering what exactly does the Exponential Moving Average solves? Maybe, you can jump to your price chart and plot a 20-day EMA and 10-day SMA side by side. You’ll see that EMA is a little bit more sensitive to recent price changes. It’ll still be a smooth line but more reactive to the market trends. EMA solves the lag that SMA couldn’t. GIves better signals. And doesn’t allow you to miss the highs and lows as much as the SMA.
Now, instead of deep-diving into the formula, let’s briefly discuss what exactly makes it more reactive. The Math formula behind the EMA focuses more on ‘recent’ data. The calculation is such that, it puts more weightage on newer price points and less weightage on the older ones. The primary agenda is to put more emphasis on what the traders are doing at the moment. This is different from the calculation of SMA which puts ‘equal’ weightage on prices of all dates.
Hence, the EMA hugs the price tightly and is usually more preferred than SMA. It can be used exactly like SMA, but it’s better!
You also need to understand one thing over here – a 10-day EMA will obviously be more reactive compared to a 10-day SMA. But to find out the difference between a longer-term 20-day EMA and a shorter-term 10-day SMA, you need to put those down on your price chart. Why don’t you do that now! Pull out your favorite stock and do some beta testing to find out the difference between the two Moving Averages.
| The Objective / Use-Cases | |
| EMA | SMA |
| shorter time frames | when holding a position for a longer period of time |
| fast-moving markets | to filter out noise |
Trading Strategy for Exponential Moving Average:
- Buy strategy: If the short term trend is bullish, then you can use: 20 EMA is higher than 40 EMA
- Sell strategy: If the short term trend is bearish, then you can use: 20 EMA is lower than 40 EMA
Double Exponential Moving Average (DEMA)
Yet another Moving Average formed with the sole purpose to reduce the lag. This is nothing but the EMA of an EMA. The goal is to reduce the lag.
Trading Strategy for Double Exponential Moving Average:
- Buy strategy: If the short term trend is bullish, then you can use: 10 DEMA crosses above 20 DEMA or Close crosses above 30 DEMA
- Sell strategy: If the short term trend is bearish, then you can use: 10 DEMA crosses below 20 DEMA or Close crosses below 30 DEMA
Triple Exponential Moving Average (TEMA)
As the name suggests, the calculation of this indicator involves the EMA, of an EMA, of an EMA.
Trading Strategy for Triple Exponential Moving Average:
- Buy strategy: If the short term trend is bullish, then you can use 10 TEMA crosses above 20 TEMA or Close crosses above 30 TEMA
- Sell strategy: If the short term trend is bearish, then you can use 10 TEMA crosses below 20 TEMA or Close crosses below 30 TEMA
Weighted Moving Average (WMA)
Just like the Exponential Moving Average, the Weighted Moving also put more ‘weightage’ on the recent price points. But the WMA is even more sensitive.
In the world of trading, it is said that the ‘most recent data’ is more sacred compared to the historical data of the distant past. The newer data points can help out with a better analysis of the market. The Formula behind the WMA is such that it applies great weightage to the current data and the weightage decreases with each previous price.
WMAs have different weights assigned based on the number of periods used in the calculation. If you want a weighted moving average of four different prices, then the most recent weighting could be 4 to 10. The previous period could weigh 3 to 10. The third period could have a weighting of 2 to 10, and so on.
Now, a weight of 4 to 10, for example, means you have 10 recent periods and their prices. You choose the four most recent prices. This accounts for 40% of the value of the WMA. The price four periods ago only accounts for 10% of the WMA value. This can be illustrated with the following example: assume prices of 90, 89, 88, 89, with the most recent price first. You would calculate this as [90 x (4/10)] + [89 x (3/10)] + [88 x (2/10)] + [89 x (1/10)] = 36 + 26.7 + 17.6 + 8.9 = 89.2
Trading Strategy for Weighted Moving Average:
- Buy strategy: If the short term trend is bullish, then you can use 10 WMA crosses above 20 WMA or Close crosses above 30 WMA
- Sell strategy: If the short term trend is bearish, then you can use 10 WMA crosses below 20 WMA or Close crosses below 30 WMA
Triangular Moving Average (TMA)
The Triangular Moving Average is basically a double-smoothed curve. This means that the data is averaged twice (by averaging the simple moving average). The bottom line is, it is basically a type of Weighted Moving Average which applies weights in a Triangular pattern.
The calculation goes like this:
Step 1: Calculate the SMA: SMA = (D1 + D2 + D3 + . . . . . . + Dn) / n
Step 2: Calculate the average of SMAs: TMA = (SMA1 + SMA2 + SMA3 + . . . . . . + SMAn) / n
If you pit it against the SMA and EMA, you’ll see that TMA is more sensitive/smoother compared to the SMA but less sensitive compared to the EMA.
Trading Strategy for Triangular Moving Average:
- Buy strategy: If the short term trend is bullish, then you can use 10 TMA crosses above 20 TMA or Close crosses above 30 TMA
- Sell strategy: If the short term trend is bearish, then you can use 10TMA crosses below 20 TMA or Close crosses below 30 TMA
Hull Moving Average (HMA)
Call it HMA. Call it a gem. The Hull Moving Average solves the dilemma of making a Moving Average more responsive to current price activity whilst maintaining curve smoothness. This indicator is designed to reduce the lag often associated with EMAs and WMAs by providing a faster signal on a smoother visual plane. It was developed by Alan Hull and has found its way into the charting programs around the world.
As we already know that Moving Averages work best with Cross-Overs. But the Alan Hull, the developer of this indicator doesn’t recommend this strategy with the HMA. So why exactly is that the case? When we use two moving averages in a cross-over strategy, we are actually trying to identify the lag between the two moving averages. But with the HMA, the lag has already been reduced significantly.
Trading Strategy for Hull Moving Average:
- Buy strategy: If the short term trend is bullish, then you can use 20 HMA crosses above 20 SMA
- Sell strategy: If the short term trend is bearish, then you can use 20 HMA crosses below 20 SMA
You must be thinking now – So many moving averages! Which one to chose?
Most of the less-laggy indicators give so many signals, most of them come to be false. You’ll keep jumping in and out of positions with no profit-making trend insight. This is the point you’ll crave a fast trading trend that works without large losses which save you from being whipsawed. But the perfect combination doesn’t really exist. And it is possible to have a fast-moving trading trend in which you must get in and get out quickly!
This is where the next type of Adaptive Moving Average comes into the picture. Let’s talk about it below.
Kaufman’s Adaptive Moving Average (KAMA)
Promise, this is the last one. And also the best one!
The Moving Kaufman technology has gone through numerous iterations and upgrades over the years to provide great user control. Guessing what this means? This indicator has an incredible quality which lets the system automatically make changes in its speed according to market volatility. This indicator, an adaptive moving average (AMA), moves very slowly when markets are moving sideways but moves swiftly when the markets also move swiftly, change directions, or break out of a trading range.
The highlight of KAMA is that it changes into blue color when the price holds its position above the level to signal a Bullish trend. Now, if the market is sideways, the KAMA with continue as a horizontal line of the same color. And then it turns red as soon as the price closes below the level. This signifies a Bearish trend. This indicator ends up shows low reactivity against price changes. It greatly filters out the price noise and you easily detect a trend with the minimal possible lag.
The Math behind KAMA is based on the EMA. What the formula does is that it greatly increases the EMA’s smoothening effect. And then it uses an Efficiency Ratio Indicator to make the KAMA smart enough to adapt to price changes.
Advantages of KAMA
Before talking about the advantages, it is important to note that the KAMA is great for the FOREX markets. It has a really excellent capacity to adapt to FOREX charts.
Here are some of the advantages:
- It calculates the average data for many days and you can arrive at a sort of automated trend line that highlights the trend.
- It moves really slow when the markets trend sideways but more swiftly when the market accelerates fast. It automatically changes direction when there is a breakout of the trading range.
- It traverses between fast and slow-moving averages.
- It can be used to filter out the price movements, pinpoint the overall market trend and turning points.
- Lastly, it monitors the prices from far away.
Trading Strategy for Kaufman Adaptive Moving Average:
- Buy strategy:
- Sell strategy:
Bottom Line
Phew! We are finally at the end. The universe of Moving Averages is so vast. There are so many other indicators built on top of this. We have talked about most of them in our other articles. From the above chunk of information, we can understand that Moving Averages are a rather intriguing new concept. It has the right amount of intellect but a less amount of prediction power. Just remember, it is a trend-following indicator. They work brilliantly in trending markets no matter which time frame, period, or crossover-over you use. You will keep knowing more about the concept through constant practical application.
Although there are a few universal figures, most moving averages are customizable according to your comfort and trading style. It totally depends on what signals you want your moving average to give you.
Happy Trading! 😄


