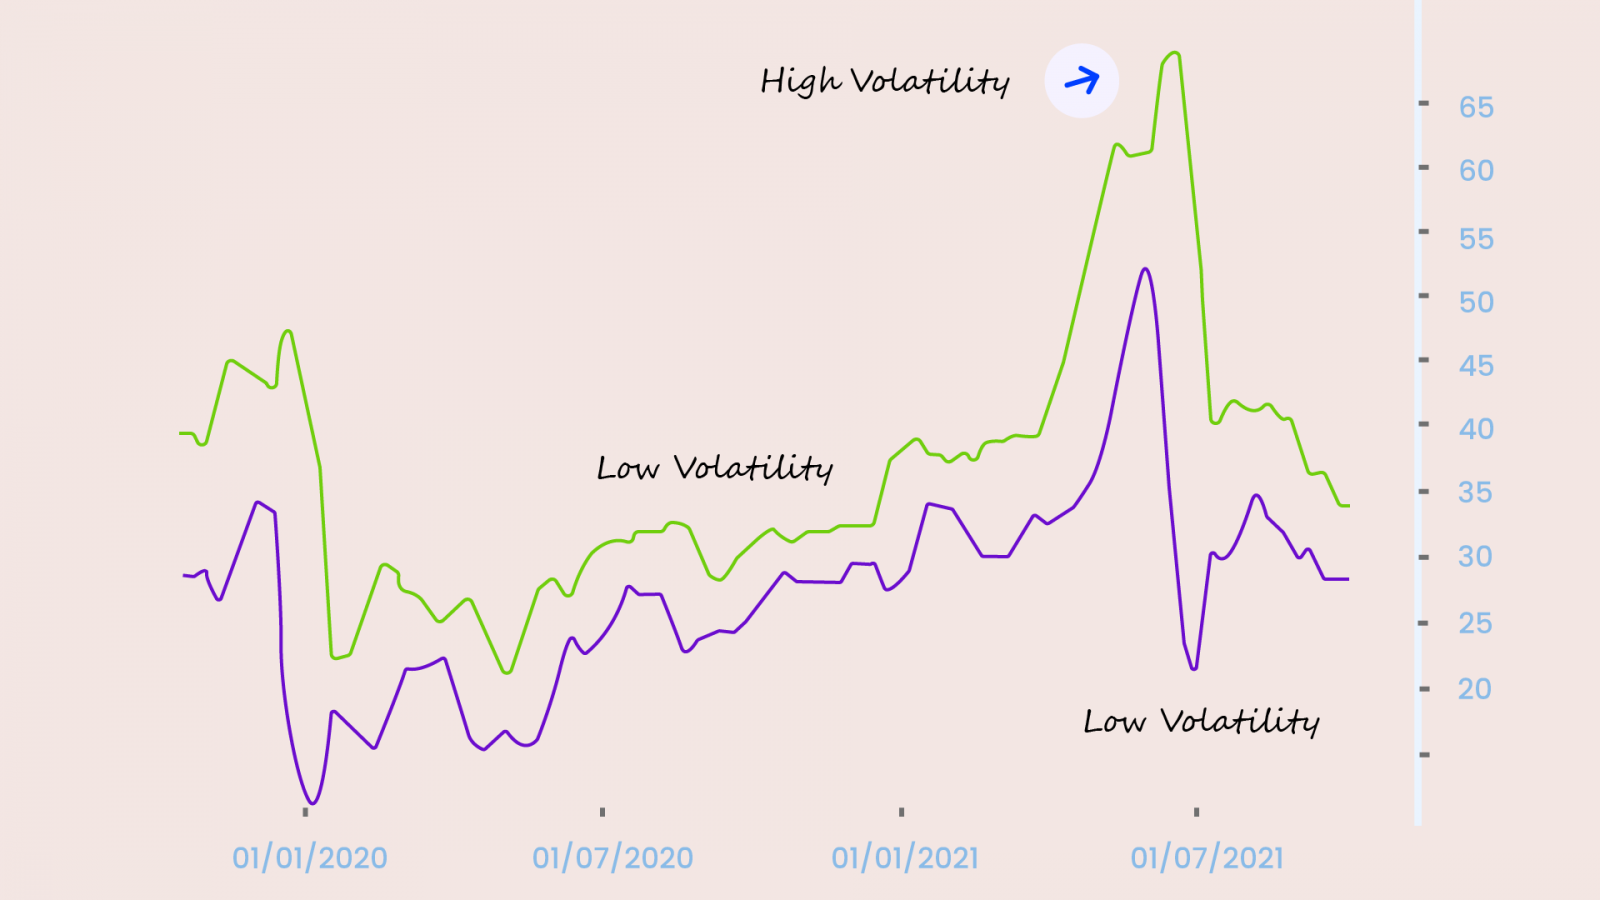
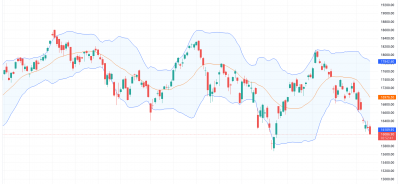
“Average True Range measures market volatility by decomposing the entire range of an asset for that period.”
Didn’t get it? Let’s simplify this indicator for you.
First thing’s first – the ATR is a Volatility indicator. It is derived from the 14-period Simple Moving Average of a series of true range indicators. Now, the difference between the high and low of a stock at any particular time interval is known as the Price Range. So what is True Range? To know the True Range, the highest of the following: current high less the current low; the absolute value of the current high less the previous close; and the absolute value of the current low less the previous close is taken into consideration. Hence, there is more to the ATR than meets the eye.
Now you cal always longer SMA periods to generate fewer and more accurate signals.
The Interpretation
It’s as simple as – the higher the level of volatility, the higher the ATR, and vice versa. But note that it doesn’t indicate price direction.
So, you can now gauge when to enter or exit trades. It is used more as an exit signal no matter how the decision is made. One of the most popular ways to do this is known as the “chandelier exit.” The Chandelier Exit places a trailing stop from either the highest high of the trade or the highest close of the trade. The distance from the high price to the trailing stop is usually set at three ATRs. It is moved upward as the price goes higher. Stops on long positions should never be lowered because that defeats the purpose of having a stop in place.
Hence, this is a great way to ride the trends. Read on if you want to know more about this.
ATR Trailing Stop Loss
A trailing stop loss is a way to move the exit point if the price is moving in your favor. It helps you trail your stop-loss either up or down. Not only that, it helps you exit a trade if the stock price moves against you. ATR is a great way to identify your stop-loss.
So, at the time of a trade, look at the current ATR reading. Then multiply the ATR by 2 (you can use any value that suits your trading style) to determine a reasonable stop loss point. If you’re buying a stock, you might place a stop loss at a level twice the ATR below the entry price. If you’re shorting a stock, you would place a stop loss at a level twice the ATR above the entry price.
Now comes the exciting part…
If you’re long and the price moves favorably, you continue to move the stop loss to twice the ATR below the price. In this scenario, the stop loss only ever moves up, not down. Once it is moved up, it stays there until it can be moved up again or the trade is closed as a result of the price dropping to hit the trailing stop loss level.
For example, say you take a long trade at INR 10 and the ATR is INR 0.10. You would place a stop loss at INR 9.80 (2 * INR 0.10 below INR 10). The price rises to INR 10.20, and the ATR remains at INR 0.10. The trailing stop loss is now moved up to INT 10. When the price moves up to INR 10.50, the stop loss moves up to INR 10.30, locking in at least a 30 paise profit on the trade. This would continue until the price falls to hit the stop-loss point.
The same applies vice versa while you have a short position with your stocks. Only in this case, the stop-loss only ever keeps moving down until the trend is over or the trend has reached a point of exhaustion.
Okay, yet another question! How to find “exhaustion” moves and time market reversals? You must agree that nobody can work “forever” without exhaustion. After an hour or so, most of us will need a break to recharge. So why are we talking about this? Because the market is just like us, it can only “work” for so long before taking a break. This means there’s a good chance the market will “exhaust” itself after hitting its limits. So what’s this limit? You can find out using the Average True Range indicator – Identify the current ATR value. Multiply it by 2. If the market moves 2 times the ATR value, then it could be “exhausted”. It is important to note that this is not absolute. You should combine it with Support & Resistance and identify market reversals.
Example: ABC has a weekly ATR value of 300. And now, you realized ABC has moved 500 (close to 2ATR) and it came into an area of Support. Then, it forms a large Bullish Engulfing pattern on the Daily timeframe. Now… what do you think will happen? Well, I can’t say for sure. But you have an “exhaustion” move, the price coming into an area of Support, and a Bullish candlestick pattern that signals the market could reverse higher.
Before we go any further, let’s clarify – which is the best ATR multiple to use. The truth is – none. There is no best STR multiple. If you use a smaller ATR multiple, then you’ll ride a small trend (and the time held on the trade is shorter). If you use a bigger ATR multiple, then you’ll ride a bigger trend (and the time held on the trade is longer). So which approach suits you best? Only you can answer that question yourself.
Using ATR to Set a Profit Target and a Perfect Stop-Loss
Are you an intraday trader? Then you’ll see that the ATR spikes right after the Indian Exchanges open at 9:15 am. This is because ATR is a measure of volatility and markets are the most volatile during the first few minutes of the day. The ATR only indicates that volatility is higher than it was at yesterday’s close. After the spike at the open, the ATR typically spends most of the day declining.
The oscillations in the ATR indicator throughout the day provide important information about how much the price is moving on an average each minute. You can use the one-minute ATR to estimate how much the price could move in five or 10 minutes. This strategy may help establish profit targets or stop-loss orders:
- Target Profits: Take your expected profit, divide it by the ATR, and that is typically the minimum number of minutes it will take for the price to reach the profit target. If the ATR on the one-minute chart is 0.5, then the price is moving about INR 0.50 per minute. If you’re forecasting the price will rise and you buy, you can expect the price is likely to take at least three minutes to rally INR 1.50.
- Stop Loss: Have you ever entered a trade only to watch the market hit your stop loss, and then continue moving in your expected direction? It sucks, right? That’s because your stop loss is “too tight”. So, what’s the solution? Give your trade enough room to breathe. This means your stop loss should be wide enough to accommodate the daily swings of the market. But how much is wide enough? You can use the ATR indicator to help you with this. Find out what’s the current ATR value. Select a multiple of the ATR value. Add that amount to the nearest Support & Resistance level. So, if you are long from Support and have a multiple of 1, then set your stop loss 1 ATR below the lows of Support. Or if you’re short from Resistance, and have a multiple of 2 then set your stop loss 2 ATR above the highs of Resistance.
Happy Trading! 😄


