“Tags of the bands are just that, tags, not signals.” – John Bollinger
Still, traders are using the Bollinger Bands in their own unique ways. Trend Direction. Potential Reversals. Monitor Volatility. Basically, one indicator, multiple uses. So, open up your charts, and let’s discuss. The Bollinger Bands is an important indicator that’s formed using the SMA (Simple Moving Average). Yes, a Moving Average, yet again!
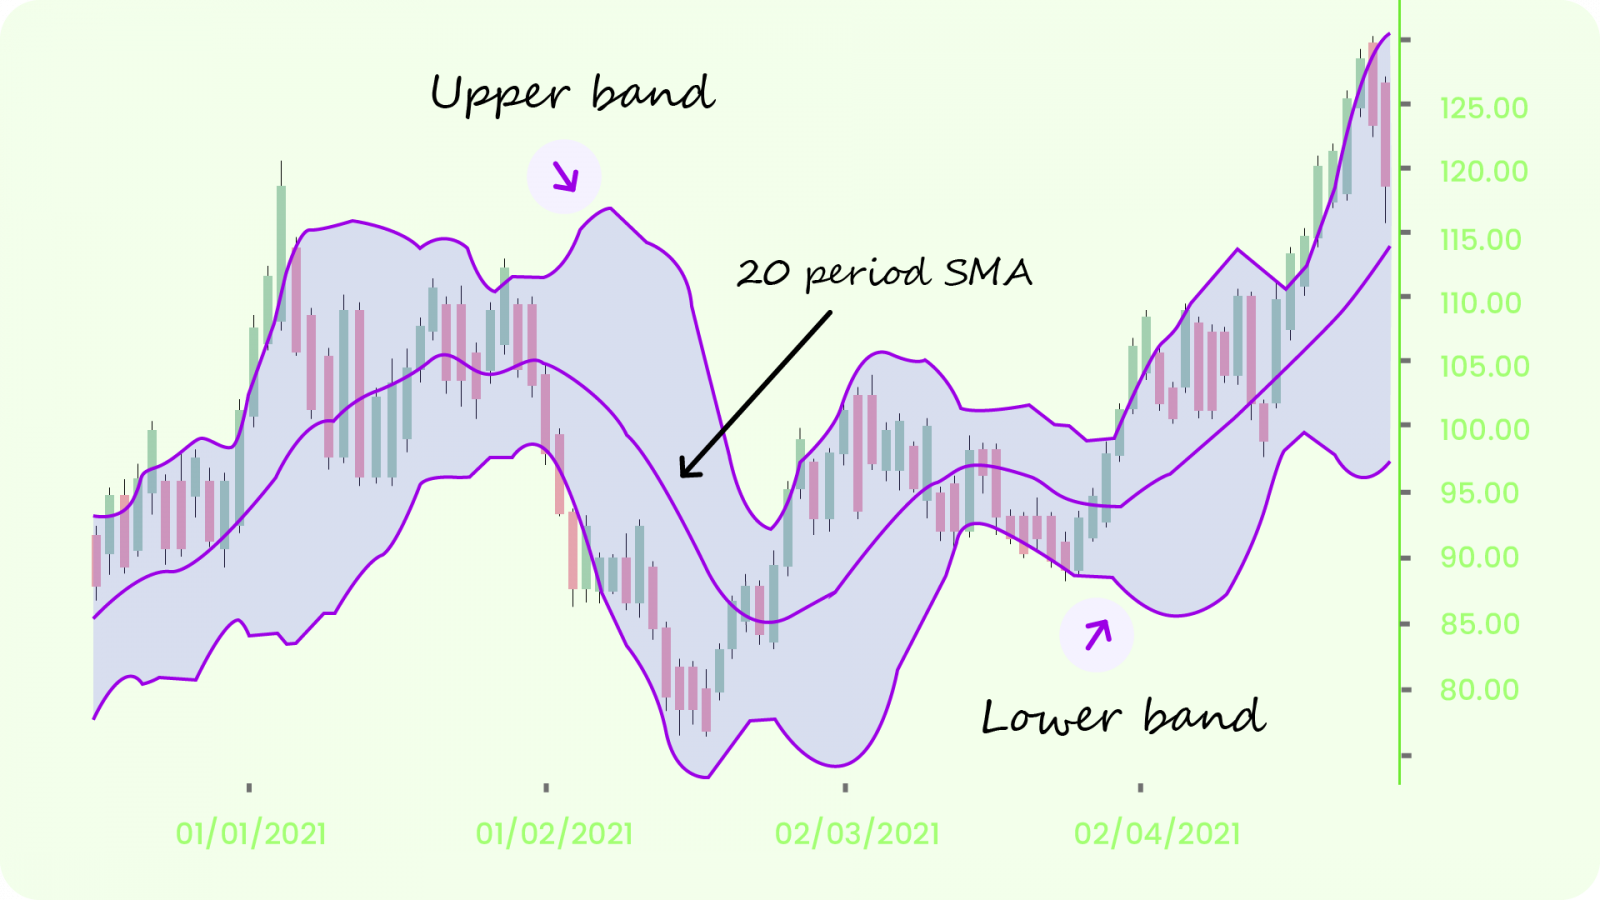
This indicator forms a channel around the price movements and consists of 3 lines:
- The Middle Bollinger Band is the Simple Moving Average of closing prices (usually a 20-day SMA is taken into account)
- The Upper Bollinger Band is +2 Standard Deviations away from the middle SMA line. A +2 SD indicates that we multiply the SD by 2 and ‘add’ it to the average. For example, if the 20-day SMA is 1000, and the SD is 9 (or 0.90%), then the +2 SD would be 1000 + (9*2) = 1018.
- The Lower Bollinger Band is -2 standard deviations away from the middle SMA line. A -2 SD indicates we multiply the SD by 2 and ‘subtract’ it from the average. For example, if the 20-day SMA is 1000, and the SD is 9 (or 0.90%), then the -2 SD would be 1000 – (9*2) = 982.
Bollinger Bands answer one very basic question: Are prices high or low on a relative basis or has the price deviated too much from the mean price? It works around the law of mean reversal. This means that if a price moves away from the mean price, it tends to return to the original mean price. Hence, this gives the investors better clarity to determine when a stock is:
- Overbought – the closer the prices move along the upper band, the more overbought the market
- Oversold – the closer the prices move to the lower band, the more oversold the market.
There are 2 important concepts to know while looking at the Bollinger Bands:
- The Squeeze – This happens when the bands come close together. The Squeeze signals a period of sideways trend and a period of low volatility. It is also considered a sign of increased volatility in the future and possible trading opportunities.
Similarly, when the bands are wider apart, it signifies higher volatility and a greater possibility of the end of an existing trend.
Limitations: These conditions do not solely determine the trading actions. The bands give no indication when the change may take place or in which direction the price could move.
- Breakouts – Most of the price action, approx 90%, usually happens within the upper and lower bands. Now, if the price breaks out of either of the bands, there is a major event.
Limitations: This breakout is not a trading signal. The mistake you might make is believing that that price hitting or exceeding one of the bands is a signal to buy or sell. Breakouts provide no clue as to the direction and extent of future price movement.
- The ‘W’ pattern – Aka double bottom on your price charts. The price drops below the lower band. It then rebounds and drops again, this time it doesn’t touch the lower limit. This is again followed by a strong rebound breaking the resistance level. Hence, the ‘W’ pattern.
- The ‘M’ pattern – Aka double tops on your price charts is the opposite of the W-bottom. The price hits the upper band. It then slumps and shoots up again, this time doesn’t touch the upper limit. Hence, the ‘M’ pattern.
This brings us to trading strategies borne out of Bollinger Bands…
Day Trading Uptrends with Bollinger Bands
Bollinger Bands helps you assess how strongly a stock is rising or when the stock is losing strength or reversing. You can use this information to make important trading decisions. So, during an uptrend what are the things you need to keep in mind?
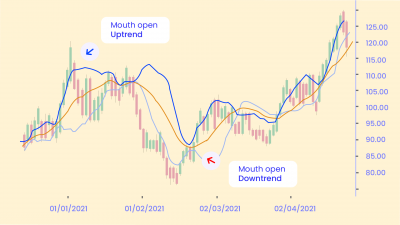
- When the price is in a strong uptrend it will typically touch or run along the upper band. When it fails to do that it shows the uptrend may be losing momentum.
- Even during an uptrend prices drop for periods, known as pullbacks. If the price is in a strong uptrend, then the pullback lows will typically occur near or above the middle moving average line. The pullback doesn’t have to come to a halt near the middle line, but it does show buying strength if it does.
- When the price is in a strong uptrend it shouldn’t touch the lower band. If it does that’s a warning sign of a reversal.
Day Trading Downtrends with Bollinger Bands
This won’t be over without discussing the pointers during a downtrend. Here they are.
- When the price is in a strong downtrend it will typically touch or run along the lower band. When it fails to do that it shows the downtrend may be losing momentum.
- Even during a downtrend, prices may rally up for periods, called pullbacks. If the price is moving strongly in a downtrend, then the pullback highs will typically occur near or below the moving average (middle) line. The pullback doesn’t have to come to a halt near the middle moving average line, but it does show selling strength if it does.
- When the price is in a strong downtrend it shouldn’t touch the upper band. If it does that’s a warning sign of a reversal.
Trading Strategy WIth Bollinger Bands:
- Buy strategy: Buy when Close crosses above LBB(20,2)
- Sell strategy: Sell when Close crosses below UBB(20,2)
Note: The outer bands are just 2 standard deviations away from the middle band (20 SMA). If you want to identify even more overstretched market conditions, you can increase the standard deviation to 3 or even more.
Creating Multiple Bands
Bollinger Bands adapt dynamically to price expanding and contracting as volatility increases and decreases. Therefore, the bands naturally widen and narrow in sync with price action, creating a very accurate trending envelope. Hence, a more useful way to trade with Bollinger Bands is to use them to gauge trends.
You can amplify this by using two sets of Bollinger Bands, one set using the parameter of “one standard deviation” and the other using the typical setting of “two standard deviations.” We can now look at price in a whole new way. We will call this Bollinger Band “bands.”
In the chart below, for example, we see that whenever price holds between the upper Bollinger Bands +1 SD and +2 SD away from mean, the trend is up; therefore, we can define that channel as the “buy zone.” Conversely, if price channels within Bollinger Bands –1 SD and –2 SD, it is in the “sell zone.” Finally, if the price meanders between the +1 SD band and –1 SD band, it is essentially in a neutral state, and we can say that it’s in uncharted territory.
Limitations
By now, you’d have understood that the price touching the Upper Bollinger Band cannot be a sell signal in itself. And vice versa. Price often can and does “walk the band.” In those markets, you’ll continuously try to “sell the top” or “buy the bottom.” You are faced with an excruciating series of stop losses, or even worse, ever-mounting losses as prices move further and further away from the original entry. Also, you shouldn’t forget that the Bollinger Bands are a result of SMA. It takes into consideration the past data and might be laggy.
Bottom Line
To balance the Bollinger Bands’ limitations, you may want to do additional research or add multiple non-related indicators. This will determine the current trend even better and help to come to conclusions. John Bollinger himself favors using the Moving Average Divergence/Convergence (MACD), On-Balance-Volume (OBV), and the Relative Strength Index (RSI) in addition to the Bollinger Bands.
Happy Trading! 😄


