Trade the Strength with the ADX!
The Average Directional Index helps you trade in the direction of the trend. Good entry and exit signals during a trending market can help you book those profits. The trend might be your friend, but it sure helps to know your other friends, too.
So let’s go? Open up your price charts and apply the ADX to your favorite stock!
What Exactly is ADX?
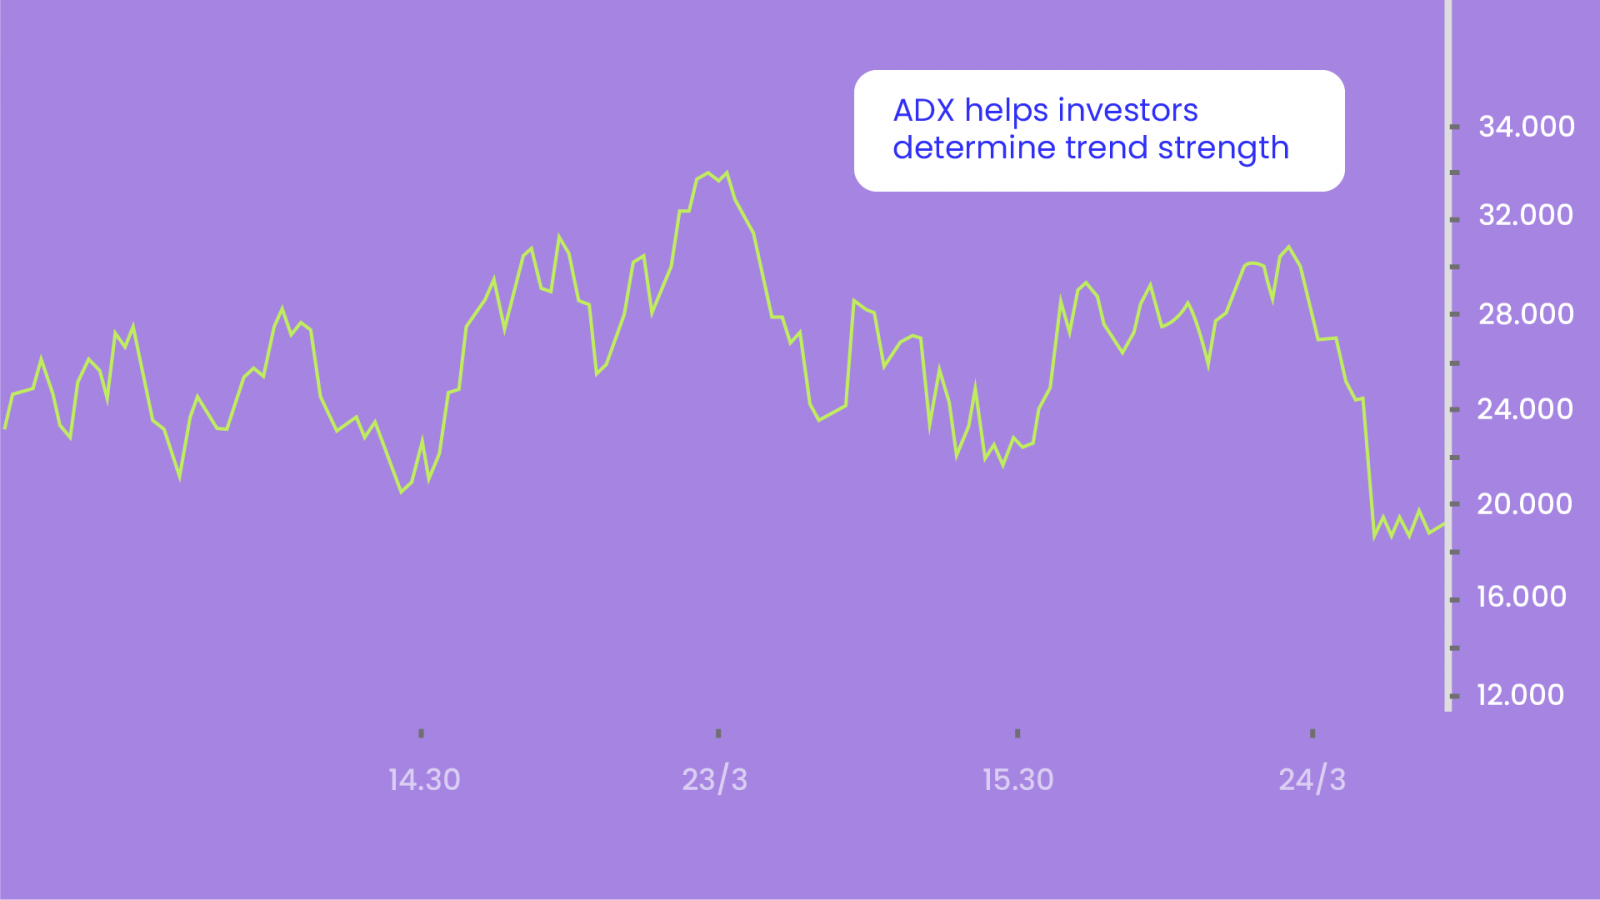
The ADX helps you quantify the strength of price movements. It’s built on the Moving Average of the price range expansion over a given period.
It is plotted as a single line with values ranging from a low of 0 to 100. ADX is non-directional. It registers the trend strength irrespective of whether the price is trending up or down. The indicator is usually plotted in the same window as the Directional Movement Indicator (DMI) lines, from which ADX is derived. Directional movement is a method of comparing two consecutive lows with their respective heights. This comparison helps to measure if DI is positive or negative. The ADX is made of 3 lines: The Trendline aka the ADX Line, Positive (+DI) & Negative (-DI)
- Positive (+DI) Directional Indicator – When the difference between the current high minus prior high is greater in value than the difference between prior low and current low, the DI is positive. The DI is positive if the difference between the current high and prior high is positive. If it is negative, the value is entered as zero.
- Negative (-DI) Directional Indicator – Conversely, the DI is negative when the difference between the historical low and current low is higher in value than the difference between the current high and prior high. For negative or minus DI, the difference between the previous low and current low must be positive. If it is negative, the value is entered as zero.
These DI points are plotted in a trading chart against each other from a DI line. When the +DI lies above the -DI, the price is moving upward. When the negative DI is above the plus DI, the price is moving downward. ADX is then applied to measure the strength of the trend.
You can notice that in both cases, when the +DI rises above the -DI and conversely, when the -DI rises above +DI, the ADX moves up, indicating the strength of the trend.
The ADX identifies a strong trend when the ADX is over 25 and a weak trend when the ADX is below 20. Crossovers of the -DI and +DI lines can be used to generate trade signals. For example, if the +DI line crosses above the -DI line and the ADX is above 20, or ideally above 25, then that is a potential signal to buy. On the other hand, if the -DI crosses above the +DI, and the ADX is above 20 or 25, then that is an opportunity to enter a potential short trade.
Crosses can also be used to exit current trades. For example, if long, exit when the -DI crosses above the +DI. Meanwhile, when the ADX is below 20 the indicator is signaling that the price is trendless and that it might not be an ideal time to enter a trade with a trend-following strategy. But note that there are strategies for sideways markets which can be deployed when ADX is signaling a lack of trend.
Quantifying Trend Strength
The first requirement is for ADX to be above 25. This ensures that prices are trending. You might, however, use 20 as the key level.
| ADX Value | Trend Strength |
| 0-25 | Absent or Weak Trend |
| 25-50 | Strong Trend |
| 50-75 | Very Strong Trend |
| 75-100 | Extremely Strong Trend |
Between 0-25 is also known as a Trendless market. But it doesn’t necessarily mean that the price isn’t moving. Instead, the price could also be making a trend change or is too volatile for a clear direction to be present. It a sign of accumulation or distribution. When ADX is below 25 for more than 30 bars, price enters range conditions, and price patterns are often easier to identify. Price then moves up and down between resistance and support to find selling and buying interest, respectively. From low ADX conditions, the price will eventually break out into a trend.
The direction of the ADX line is important for reading trend strength. When the ADX line is rising, the trend strength is increasing, and the price moves in the direction of the trend. When the line is falling, the trend strength is decreasing, and the price enters a period of retracement or consolidation.
A common misperception of the ADX indicator is that – a falling ADX line means the trend is reversing. This is NOT correct. A falling ADX line only means that the trend strength is weakening. As long as ADX is above 25, it is best to think of a falling ADX line as ‘less strong.’
Trend Momentum
Before you read any further, you should know what exactly is momentum. It is defined as the ‘quantity of motion a stock has.’ Momentum is a term used in Physics and shouldn’t be confused with the speed at which the markets move (although it’s partly true). Now, a series of higher ADX peaks means trend momentum is increasing. A series of lower ADX peaks means trend momentum is decreasing. Any ADX peak above 25 is considered strong, even if it is a lower peak. In an uptrend, the price can still rise on decreasing ADX momentum because overhead supply is eaten up as the trend progresses.
Knowing when trend momentum is increasing can give you the confidence to let profits run instead of exiting before the trend has ended. However, a series of lower ADX peaks is a warning to watch price and manage risk.
ADX can also show momentum divergence. When price makes a higher high and ADX makes a lower high, there is negative divergence or non-confirmation. In general, divergence is not a signal for a reversal, but rather a warning that trend momentum is changing. It may be appropriate to tighten the stop-loss or take partial profits.
Any time the trend changes character, it is time to assess and/or manage risk. Divergence can lead to trend continuation, consolidation, correction, or reversal.
Trading Strategy with ADX
The best trends rise out of periods of price range consolidation. Breakouts from a range occur when there is a disagreement between the buyers and sellers on price, which tips the balance of supply and demand. Whether it is more supply than demand or more demand than supply, it is the difference that creates price momentum.
Breakouts are not hard to spot, but they often fail to progress or end up being a trap. However, ADX tells you when breakouts are valid by showing when ADX is strong enough for the price to trend after the breakout. When ADX rises from below 25 to above 25, the price is strong enough to continue in the direction of the breakout.
Conversely, it is often hard to see when price moves from trend to range conditions. ADX shows when the trend has weakened and is entering a period of range consolidation. Range conditions exist when ADX drops from above 25 to below 25. In a range, the trend is sideways, and there is a general price agreement between the buyers and sellers. ADX will meander sideways under 25 until the balance of supply and demand changes again.
The Bottom Line: Finding Friendly Trends
The best profits come from trading the strongest trends and avoiding range conditions. ADX not only identifies trending conditions but also helps the trader find the strongest trends to trade. The ability to quantify trend strength is a major edge for traders. It also has to be noted that crossovers can occur frequently, sometimes too frequently. This may result in confusion and potential loss. These are called false signals and are more common when ADX values are below 25. That said, sometimes the ADX reaches above 25, but is only there temporarily and then reverses along with the price.
Happy Trading! 😄


