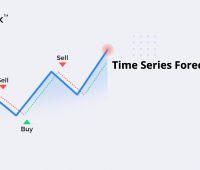
The Time Series Forecast (TSF) is a technical indicator that uses linear regression to plot a line that best fits historical price data. The…
Overlap Studies
Overlap Studies
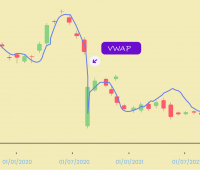
Volume Weighted Average Price: VWAP
Are you in search of an indicator that shows the equilibrium level of stocks? Your search is over! The VWAP aka Volume Weighted Average…
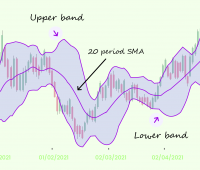
Bollinger Bands
“Tags of the bands are just that, tags, not signals.” – John Bollinger Still, traders are using the Bollinger Bands in their own unique…
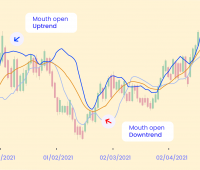
Alligator
Are you a trader? And unfamiliar with the Alligator Indicator? Get ready for a surprise – in this article we are going to discuss…
Ichimoku Cloud
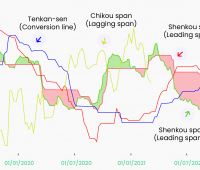
The Ichimoku Cloud, a great gift the Japanese gave us other than the CandleStick charts. So open up your price charts and apply the…
Parabolic SAR
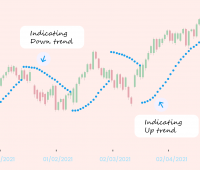
The Parabolic SAR aka the Stop and Reverse indicator. But the developer of this indicator, JW Wilder, preferred to call it the Parabolic Time/Price…
SuperTrend
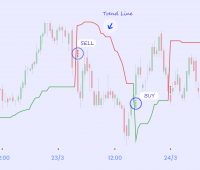
Super confused with the SuperTrend? This might be the only article you’ll need! And if you’re a swing trader? This might be the only…
The Moving Average
We all know that “The trend is your friend (until the end when it bends)”. Moving Averages are great indicators to gauge trend direction.…
Three ways to use the VWAP indicator
It is one of the most popular indicators among intraday traders. VWAP stands for Volume Weighted Average Price. As the name suggests, it averages…


