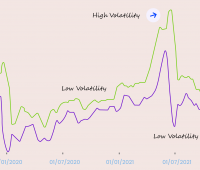
“Average True Range measures market volatility by decomposing the entire range of an asset for that period.” Didn’t get it? Let’s simplify this indicator…
Technical Indicators
Know about more than 70 indicators
Alligator
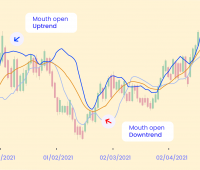
Are you a trader? And unfamiliar with the Alligator Indicator? Get ready for a surprise – in this article we are going to discuss…
Ichimoku Cloud
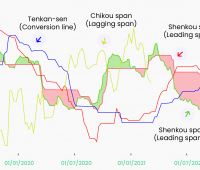
The Ichimoku Cloud, a great gift the Japanese gave us other than the CandleStick charts. So open up your price charts and apply the…
Parabolic SAR
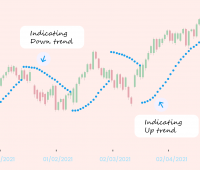
The Parabolic SAR aka the Stop and Reverse indicator. But the developer of this indicator, JW Wilder, preferred to call it the Parabolic Time/Price…
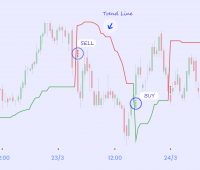
SuperTrend
Super confused with the SuperTrend? This might be the only article you’ll need! And if you’re a swing trader? This might be the only…
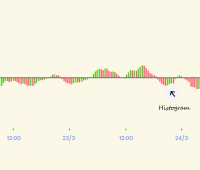
Awesome Oscillator
The Awesome Oscillator was invented by Bill Williams. So Bill, what were you thinking before while giving this indicator a name? Now the question…
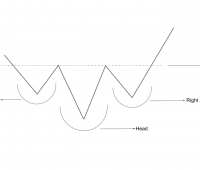
Head and Shoulders Pattern
The Head and Shoulders pattern is one of the most common reversal patterns. It is a complex pattern with several variants. This makes it…
3 of the Best Support and Resistance Indicators
Are you looking for the best support and resistance indicators? It’s quite a common question among traders as Technical trading relies heavily on the…
Price Action
“Trade what you see, not what you think”. As a trader, you need to drill one thing in mind – Price Action is King! …
Vortex Indicator
The Vortex Indicator was first proposed by J.W. Wilder in 2010. The beauty of the indicator lies in the fact that it can spot…


